The S&P 500 Index (SPX) has been trading near its all-time high, but Bitcoin (BTC) has gradually given up ground in the past few days. This suggests that supply exceeds demand in Bitcoin. According to Farside Investors data, spot Bitcoin exchange-traded funds have seen outflows for four of the five days since June 10.
However, analysts point out that long-term investors have not panicked and continue buying. Market intelligence firm Santiment shows that the number of wallets with 10 BTC or more has hit 16.6 million, the highest level since June 2022.
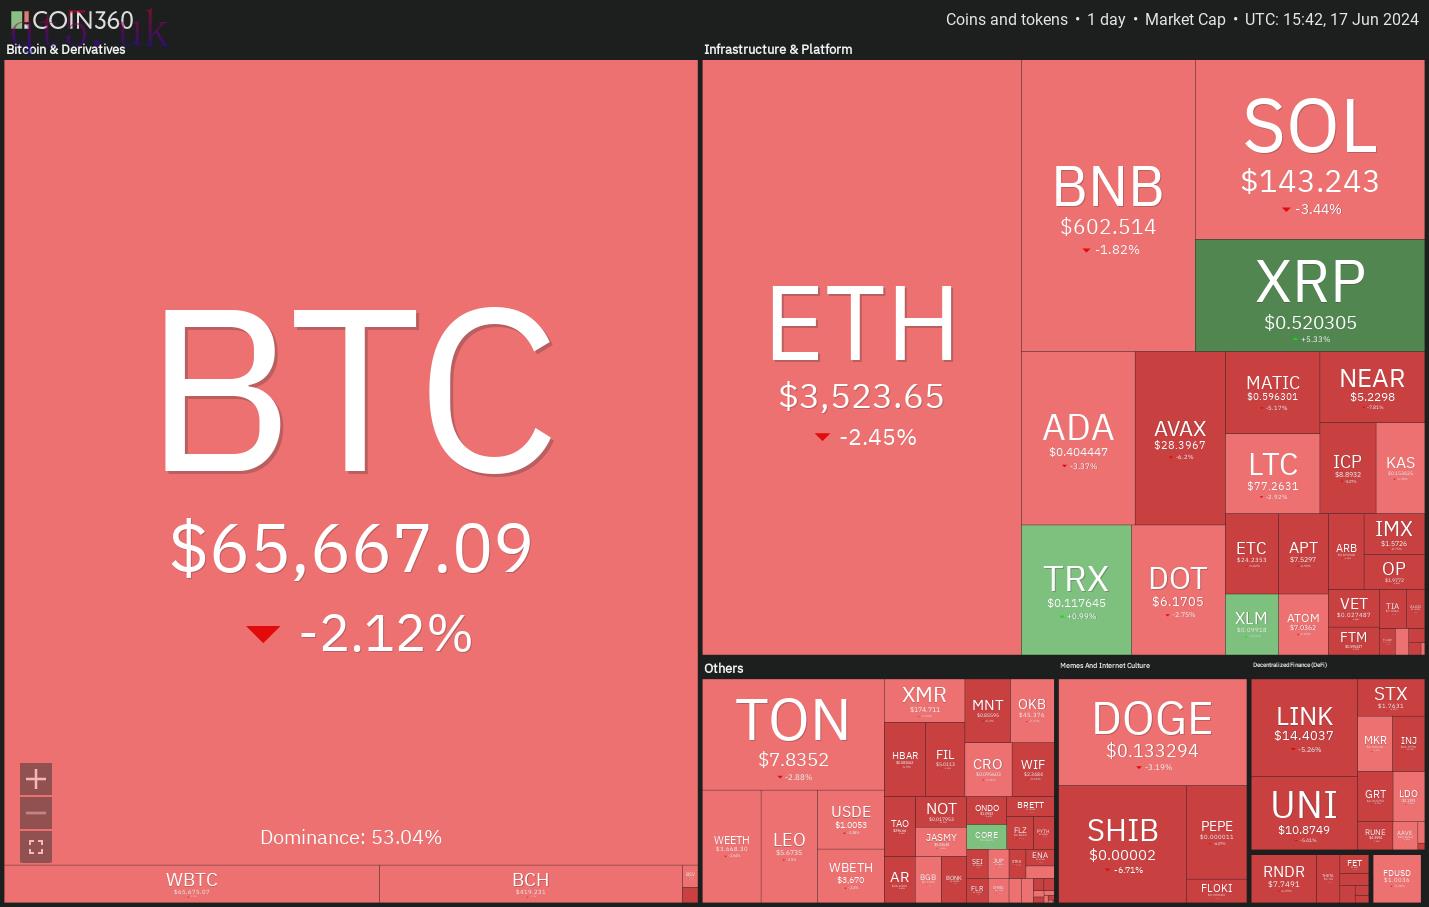 Daily cryptocurrency market performance. Source: Coin360
Although Bitcoin looks weak in the near term, it remains stuck inside a range and is likely to witness buying at the support. The longer the time spent in a range, the greater the force needed for the price to break out from it.
Could Bitcoin and select altcoins hold above their respective support levels? Let’s analyze the charts to find out.
S&P 500 Index price analysis
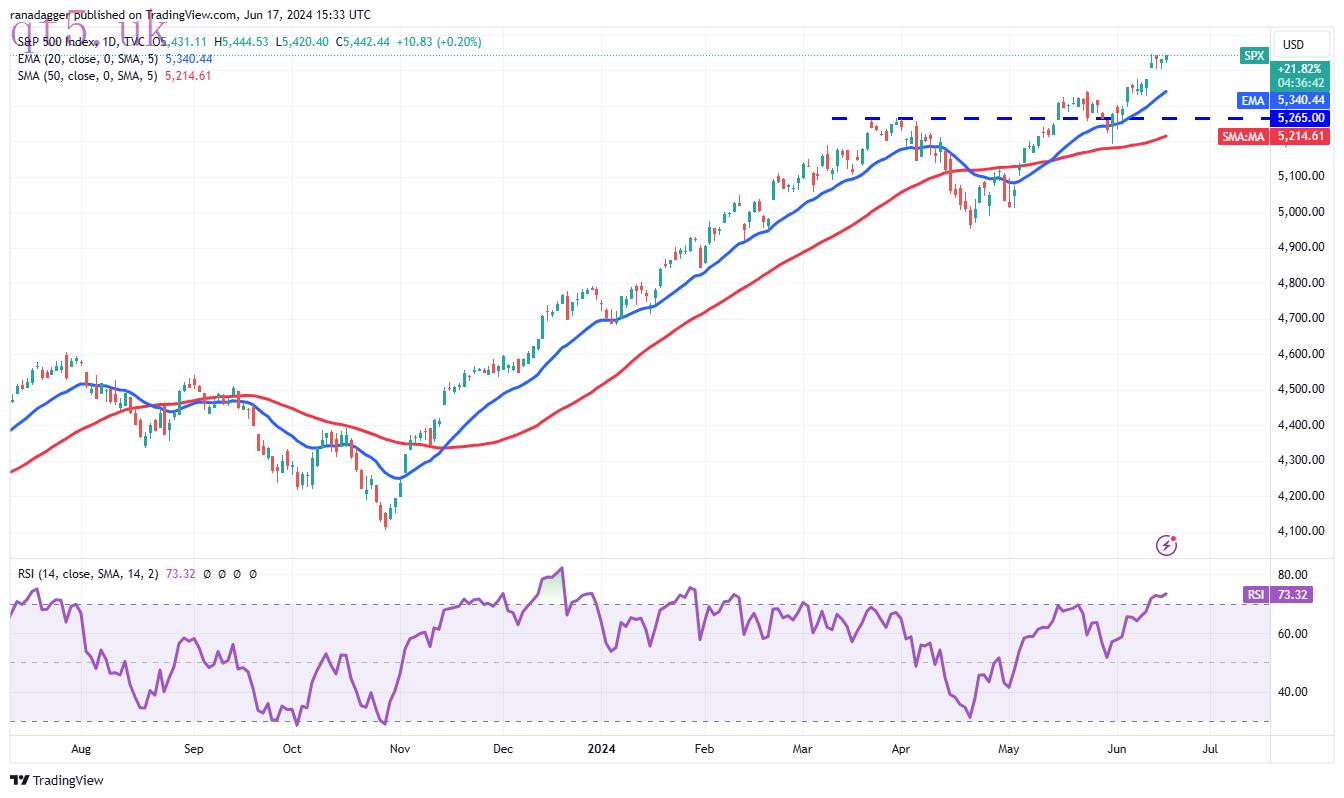
The S&P 500 Index is in an uptrend. The up move is facing selling near 5,450, but a positive sign is that the bulls have not ceded much ground to the bears.
 SPX daily chart. Source: TradingView
The 20-day exponential moving average (5,340) is sloping up, and the relative strength index (RSI) is in the overbought zone, signaling that the bulls are in command. If buyers kick the price above 5,450, the index could reach 5,600. This level may act as a resistance, but if the bulls overcome it, the index could rally toward 6,000.
The first sign of weakness will be a break and close below the 20-day EMA. Such a move will suggest that the bulls may be booking profits. That could sink the price to 5,265 and later to the 50-day simple moving average (5,214).
U.S. Dollar Index price analysis
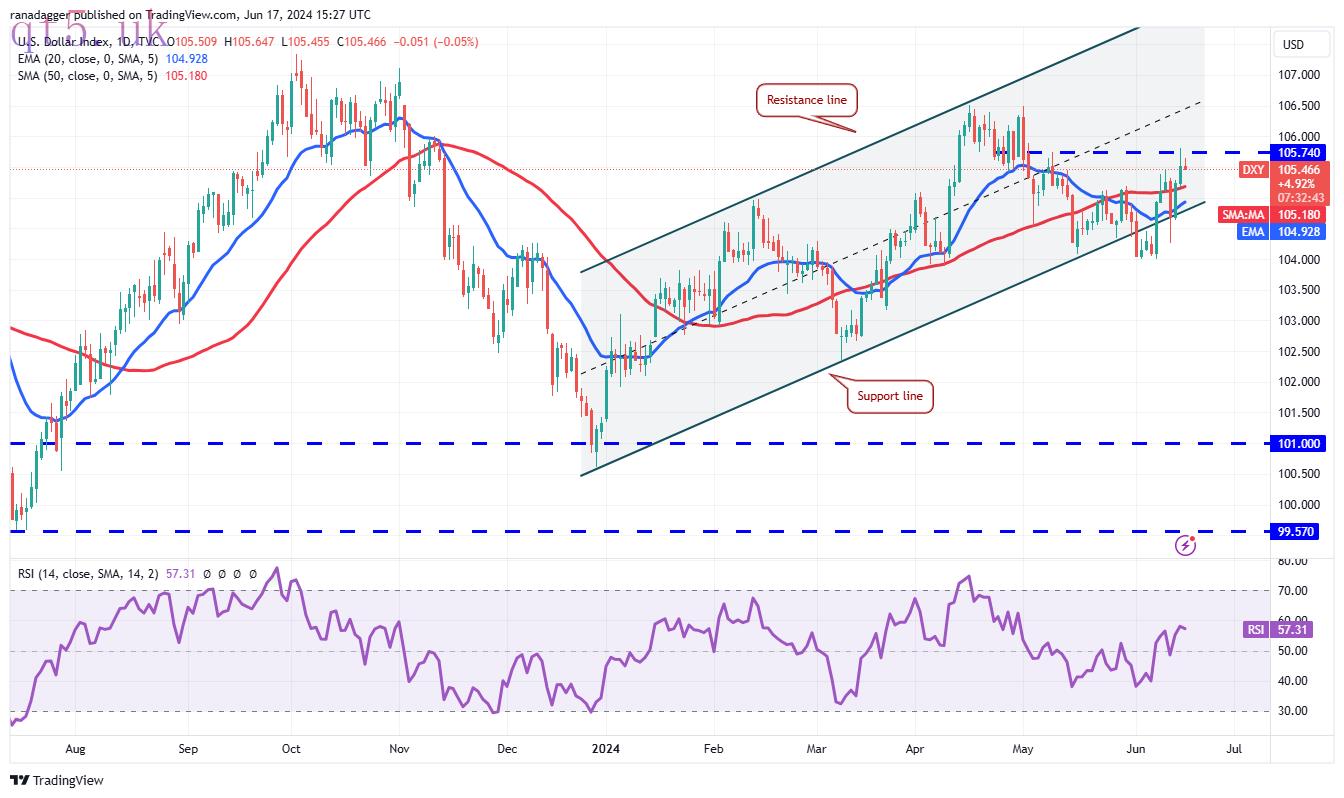
The bears tried to sustain the U.S. Dollar Index (DXY) below the support line of the ascending channel on June 12, but the bulls did not relent.
 DXY daily chart. Source: TradingView
The price bounced sharply from the support line on June 13 and reached the overhead resistance of 105.74 on June 14. The 20-day EMA (104.92) has started to rise and the RSI is in the positive zone, signaling that the path of least resistance is to the upside. If buyers shove the price above $105.74, the index could reach 106.50.
This optimistic view will be negated in the near term if the price turns down from the current level and breaks below the support line. That may tug the price down to the strong support at 104.
Bitcoin price analysis
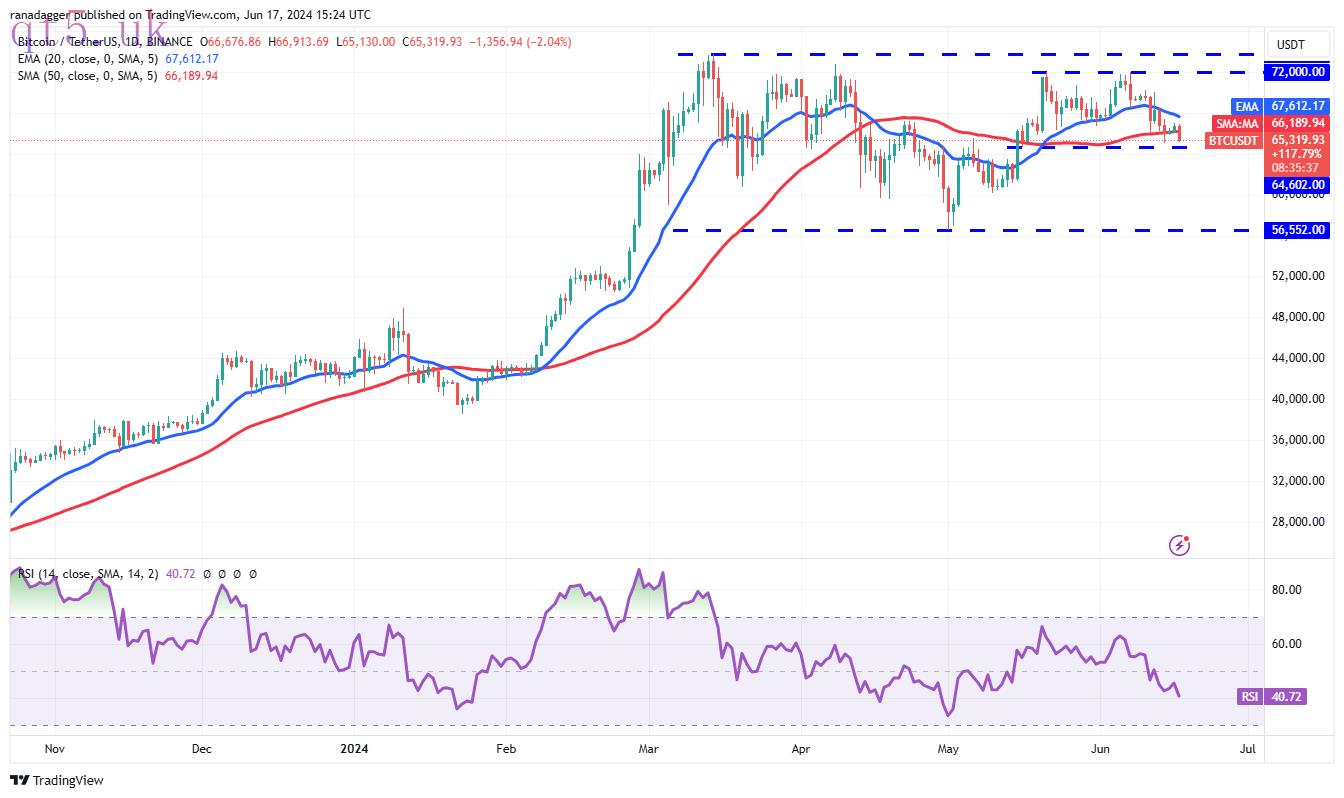
Bitcoin failed to start a bounce off the 50-day SMA ($66,189), suggesting that the bears have maintained their selling pressure.
 BTC/USDT daily chart. Source: TradingView
The critical support to watch now is $64,602. If this level cracks, the BTC/USDT pair is likely to descend to $60,000. This level may act as strong support, but if the bears prevail, the pair might tumble to $56,552.
Time is running out for the Bitcoin bulls. If they want to make a comeback, they will have to quickly push the price above the 20-day EMA ($67,612). If they do that, the pair is likely to move up to $70,000 and subsequently to $72,000.
Ether price analysis
Ether (ETH) rebounded off the 50-day SMA ($3,421) on June 14 but is facing stiff resistance at the 20-day EMA ($3,604).
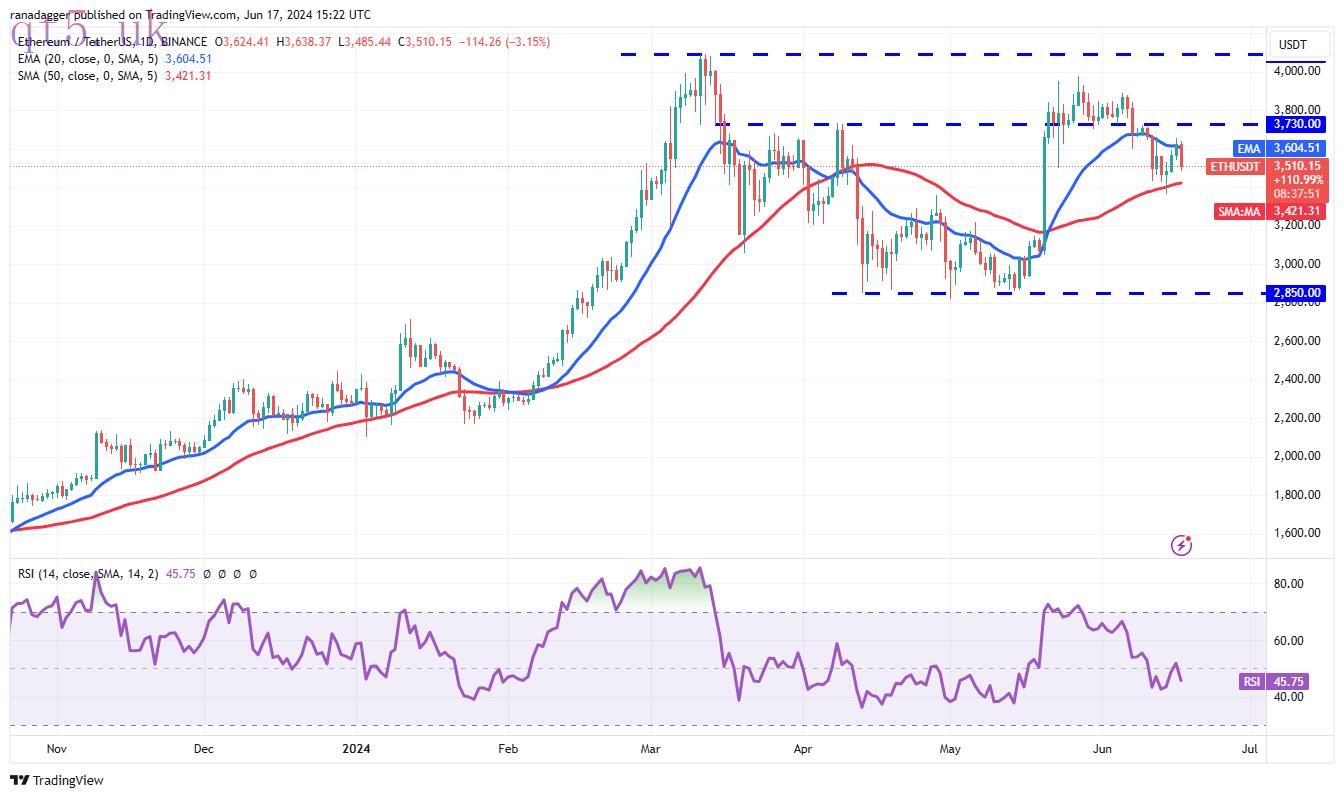 ETH/USDT daily chart. Source: TradingView
If ETH price plummets below the 50-day SMA, the advantage will tilt in favor of the bears. The ETH/USDT pair could drop to the psychological level at $3,000 and thereafter to the vital support at $2,850. This level is expected to attract strong buying by the bulls.
Contrarily, if the price turns up from the current level or rebounds off the 50-day SMA, it will signal that the bulls are buying the dips. That will increase the likelihood of a rally above the 20-day EMA. The pair may then jump to $3,730.
BNB price analysis
BNB (BNB) is witnessing a tough battle between the bulls and the bears near the 50-day SMA ($605).
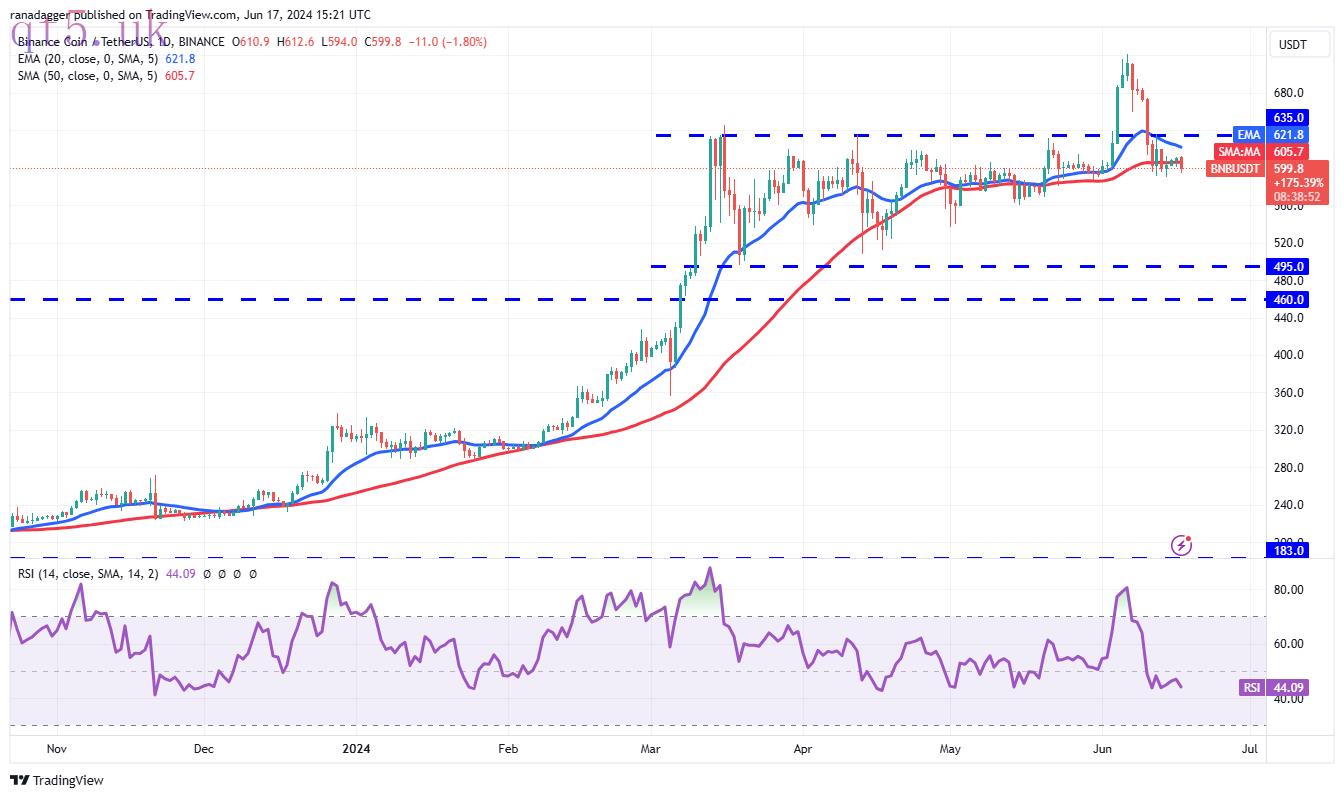 BNB/USDT daily chart. Source: TradingView
The 20-day EMA ($621) has started to turn down, and the RSI is just below the midpoint, signaling a minor advantage to the bears. If the price skids below $590, the BNB/USDT pair could drop to $560.
Alternatively, if the price turns up from the current level and breaks above $635, it will suggest that the correction may be over. The bulls will then try to push the pair to the critical overhead level of $722.
Solana price analysis
Solana (SOL) turned up from the channel’s support line on June 14 but the bulls could not push the price to the moving averages. This suggests that the bears are selling on relief rallies.
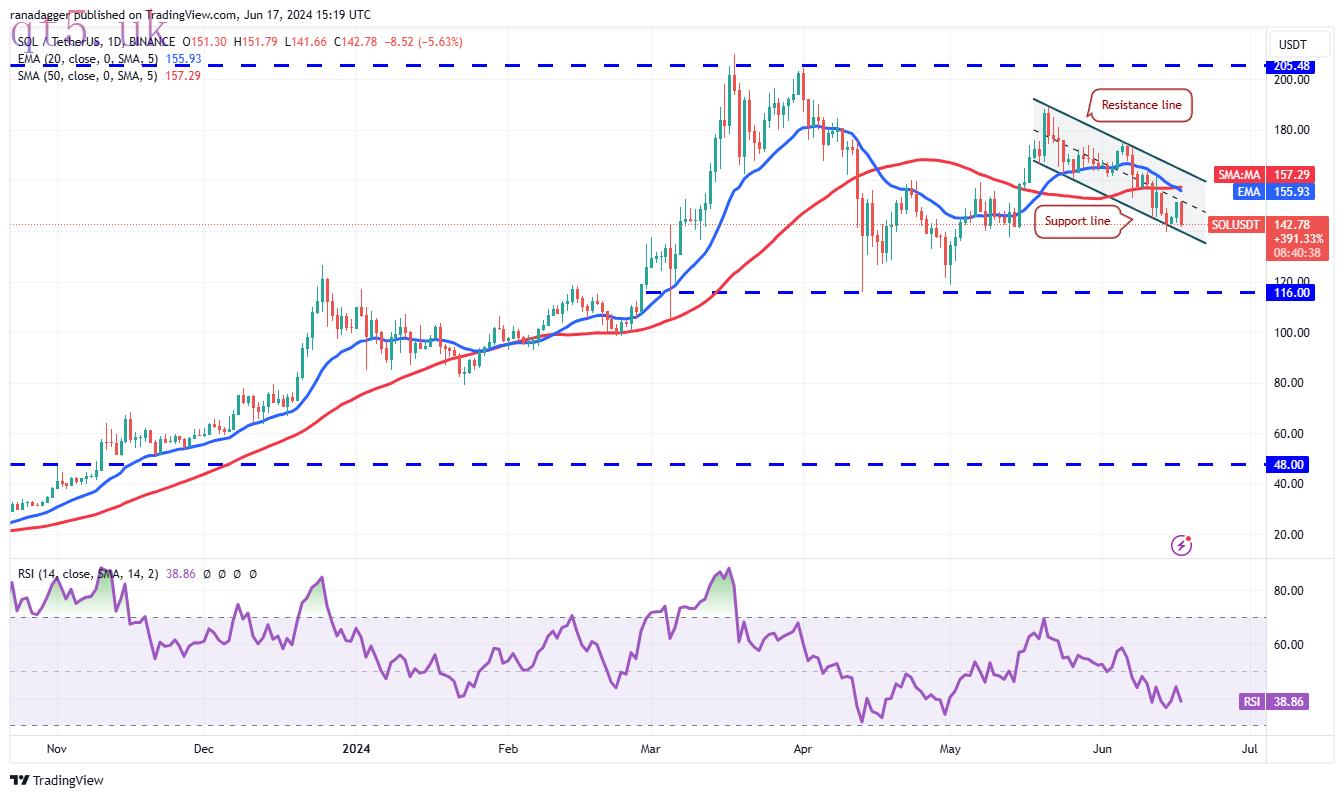 SOL/USDT daily chart. Source: TradingView
The bears will try to sink the price below the channel and start a decline to the crucial support at $116. This level has been a strong support twice before, and the bulls will again try to defend it.
This negative view will be invalidated in the near term if the price turns up and breaks above the channel’s resistance line. The SOL/USDT pair could then attempt a rally to $175, where the bears may mount a strong defense.
XRP price analysis
XRP (XRP) bounced off the $0.46 support on June 14, indicating aggressive buying by the bulls. The bears tried to stall the recovery at the 20-day EMA ($0.50), but the bulls overcame the resistance on June 17.
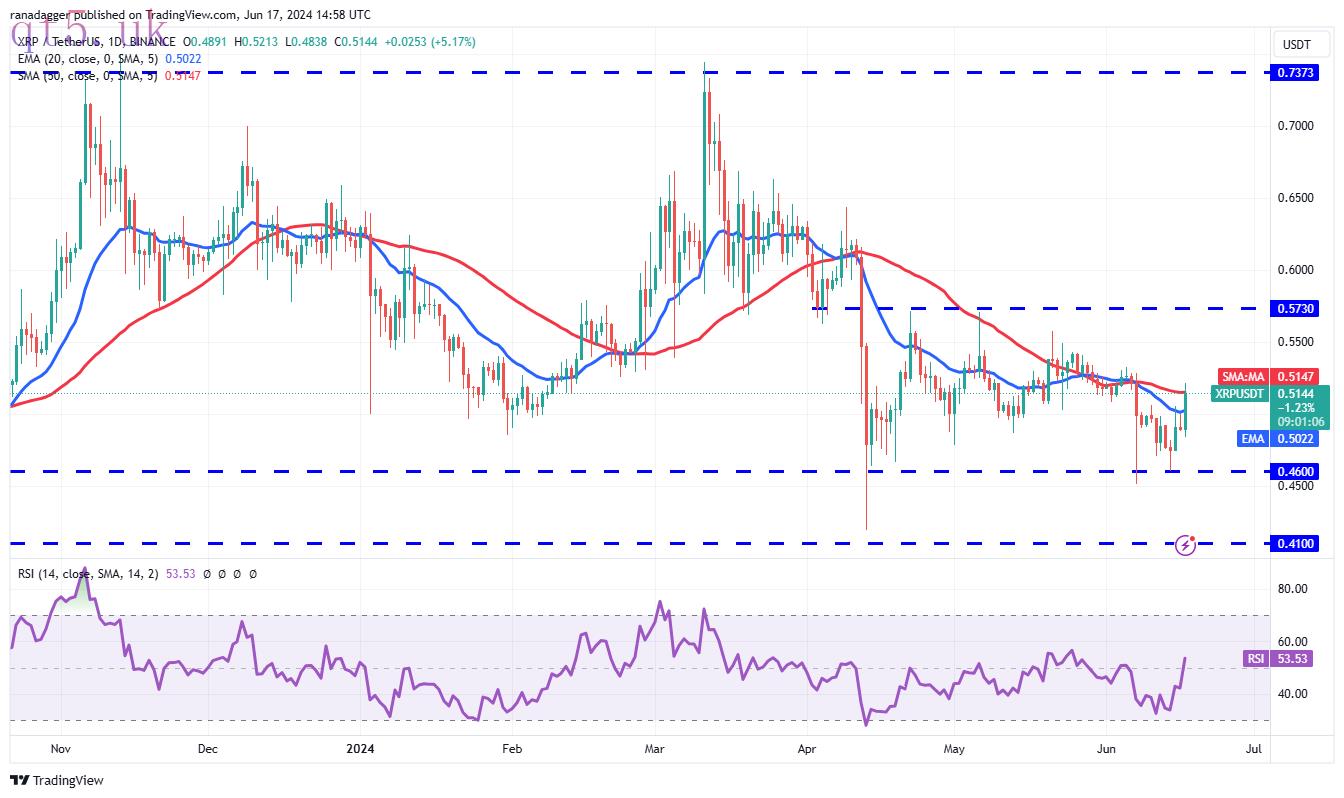 XRP/USDT daily chart. Source: TradingView
The 20-day EMA is flattening out, and the RSI has jumped into positive territory, indicating that the bears are losing their grip. If buyers sustain the price above the 50-day SMA ($0.51), the XRP/USDT pair could rally to $0.57.
Conversely, if the price turns down from the 50-day SMA and breaks below the 20-day EMA, it will suggest that the bears are selling on minor rallies. The pair could then retest the essential support at $0.46.
Related: Ethereum poised to 50% surge this year against Bitcoin — Fractal analysis
Toncoin price analysis
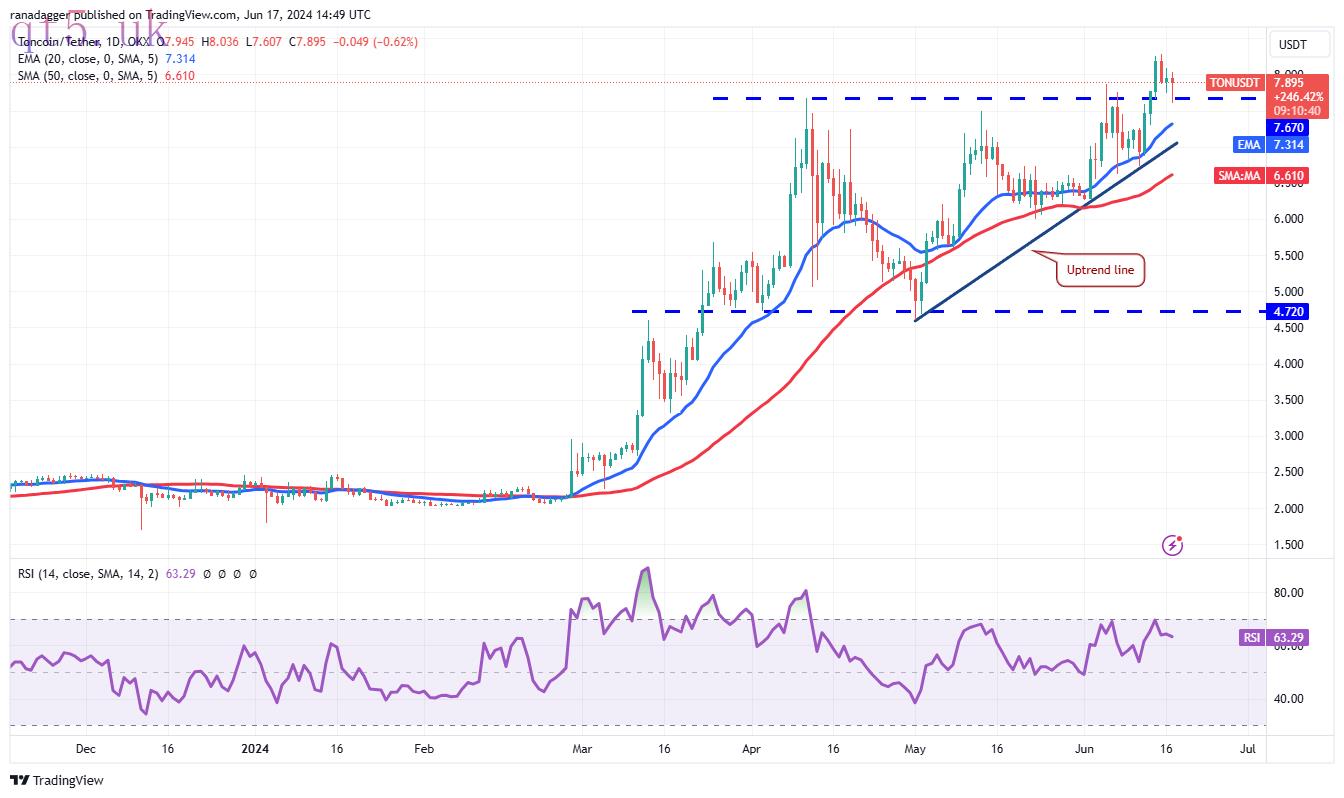
Toncoin (TON) bounced off the $7.67 level on June 16, but the bulls could not push the price to $8.29.
 TON/USDT daily chart. Source: TradingView
The bears are trying to pull and maintain the price below $7.67. If they do that, it could trap the aggressive bulls and sink the TON/USDT pair to the uptrend line. This is an important level to watch out for because a break below it will invalidate the bullish ascending triangle pattern. The pair may then slump to $6.
However, the rising moving averages and the RSI in the positive territory suggest that the bulls have the upper hand. A break and close above $8.29 will signal the start of the next leg of the uptrend. The pair may then climb to $10.
Dogecoin price analysis
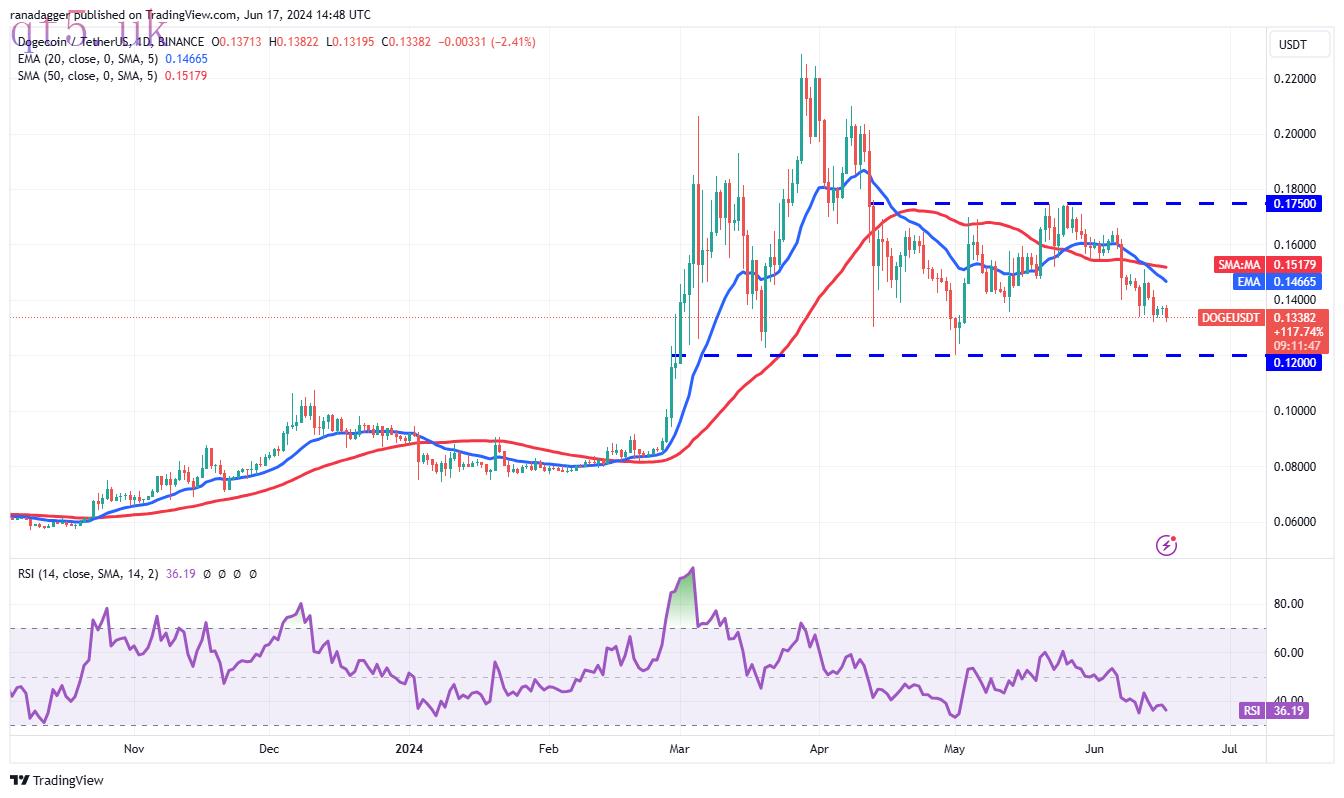
Dogecoin (DOGE) continues to slide toward the crucial support at $0.12, where the bulls are likely to step in.
 DOGE/USDT daily chart. Source: TradingView
If the price turns up from $0.12, it is likely to face selling at the 20-day EMA ($0.14). The bears will then again attempt to sink the price below $0.12. If they succeed, the DOGE/USDT pair could start the next leg of the down move to $0.08.
Alternatively, if the price turns up and breaks above the moving averages, it will signal that the bulls are aggressively defending the $0.12 level. That could keep the price stuck inside the $0.12 to $0.18 range for some more time.
Cardano price analysis
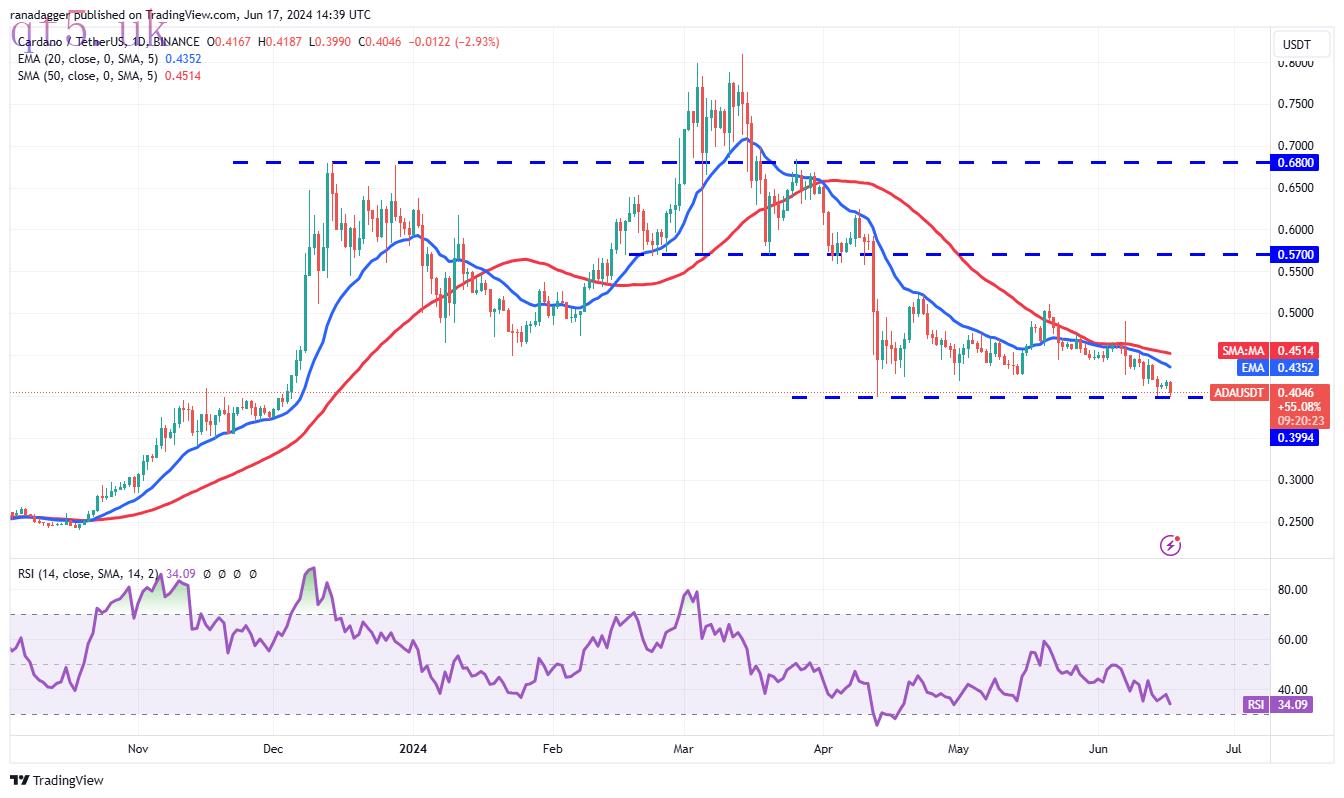
Cardano (ADA) turned up from $0.40 on June 14, but the bulls failed to push the price to the moving averages, indicating a lack of demand at higher levels.
 ADA/USDT daily chart. Source: TradingView
The bears are again trying to sink the price below the essential support at $0.40. If they can pull it off, the ADA/USDT pair may resume the downtrend. The next support on the downside is at $0.35.
If buyers want to prevent the downside, they will have to fiercely defend the $0.40 support and push the price above the moving averages. If they do that, the pair could attempt a rally to $0.49.
This article does not contain investment advice or recommendations. Every investment and trading move involves risk, and readers should conduct their own research when making a decision.


 download
 download
 website