The bears' failure to sink Bitcoin (BTC) below the support of the $56,552 to $73,777 range has started a recovery. In a range, the price generally swings between the support and the resistance. The price action in the middle is random and volatile.
A minor positive for the bulls is that they have tried to form a higher low at $58,402 on June 24. Bitcoin’s recovery could pick up pace in July if history repeats itself. CoinGlass data shows that after a negative monthly closing in June, there has been a sharp rebound every time in July.
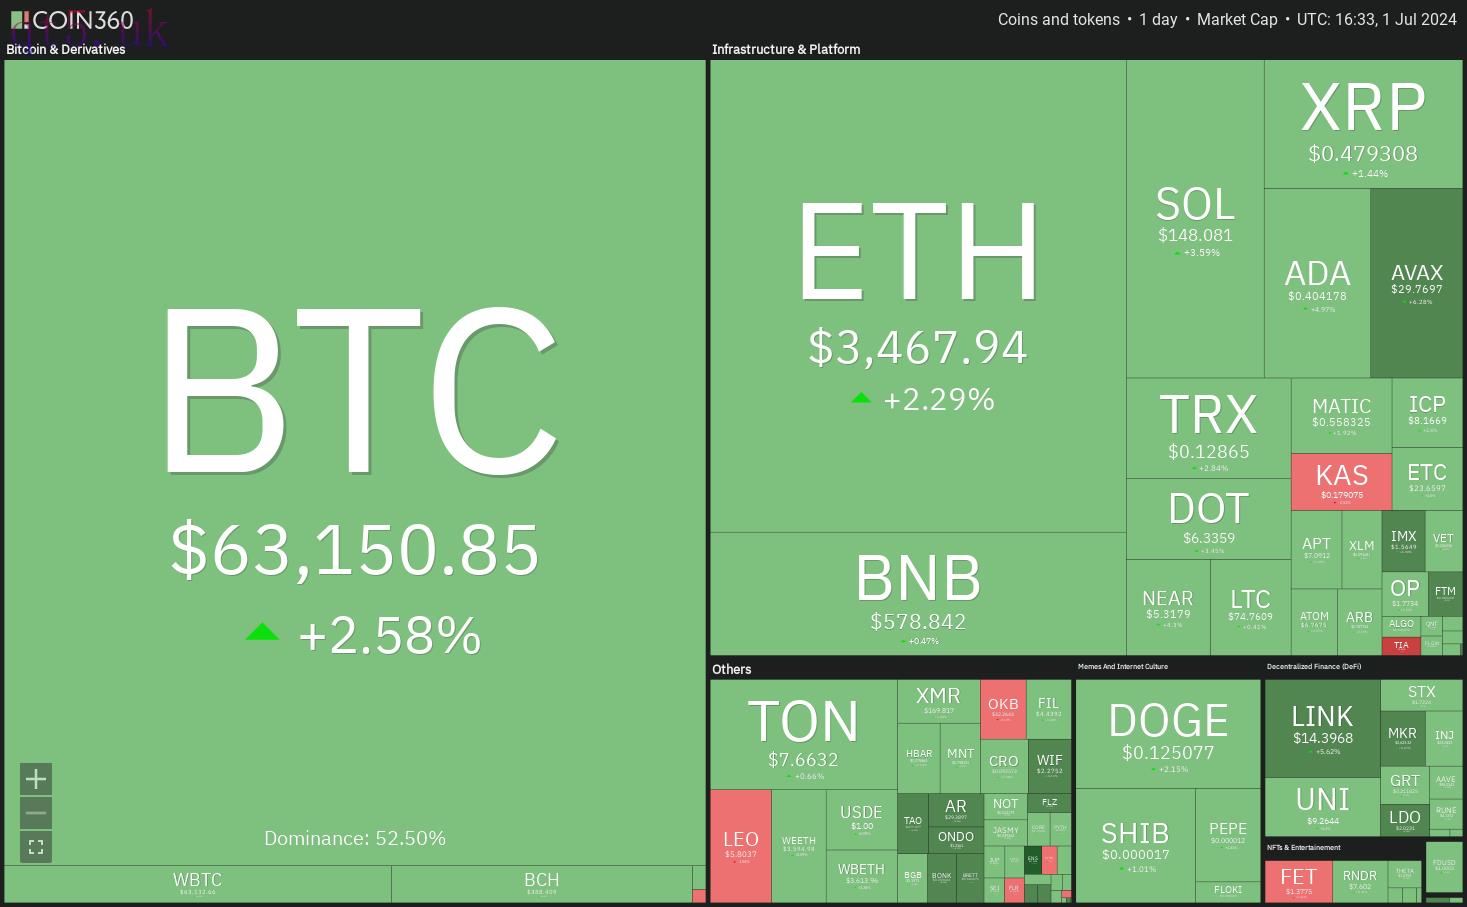 Daily cryptocurrency market performance. Source: Coin360
However, some analysts caution that the rally may face headwinds. The risk to the upside could come from the Mt. Gox repayments, starting in early July. Expectations are that creditors may rush to the exit to lock in the massive gains in Bitcoin since the hack. That could create selling pressure, which could pull Bitcoin lower.
Could Bitcoin rally in July, pulling the altcoins higher or will Mt. Gox repayments drag the markets lower? Let’s analyze the charts to find out.
S&P 500 Index price analysis
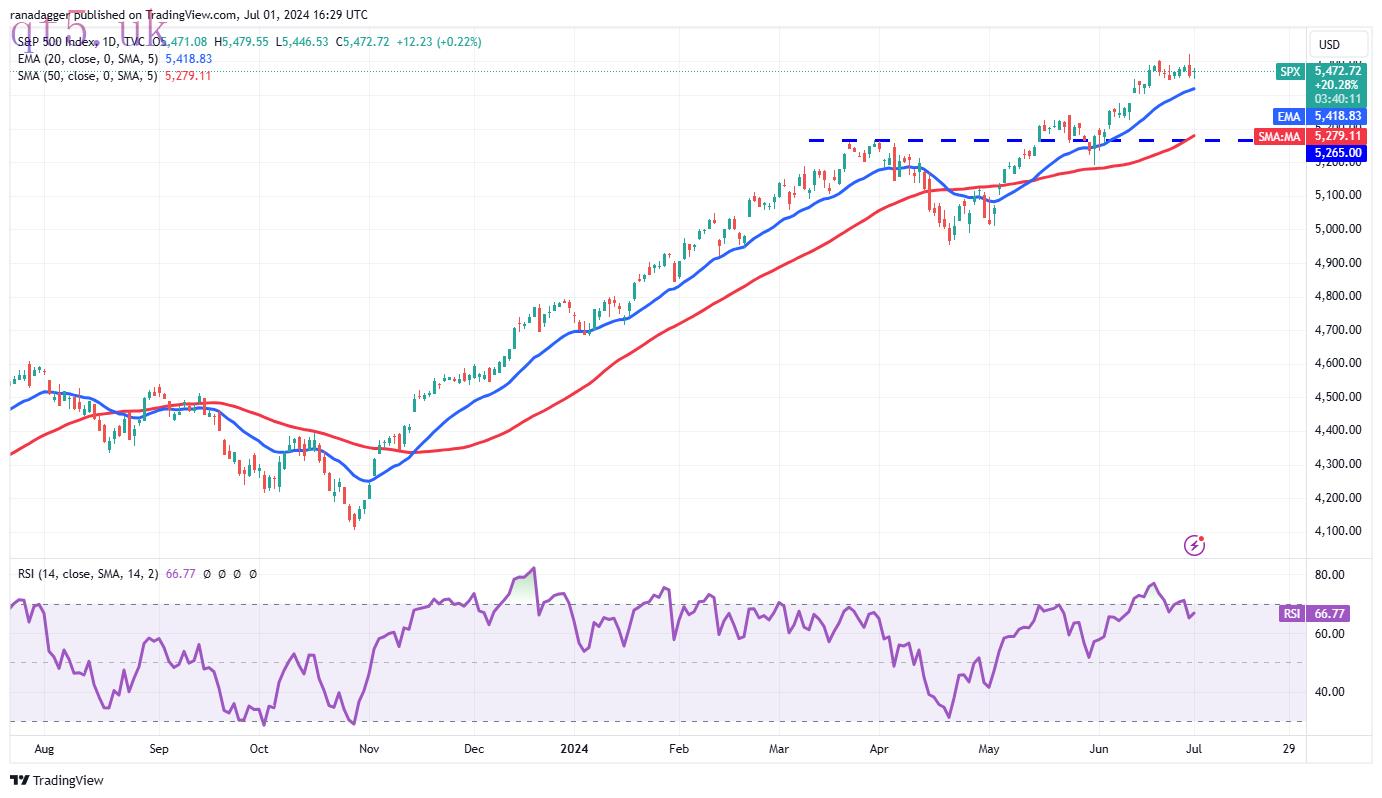
The S&P 500 Index (SPX) made a new lifetime high on June 28, but the bulls could not sustain the higher levels. This suggests profit booking by short-term traders.
 SPX daily chart. Source: TradingView
The first support to watch on the downside is the 20-day exponential moving average (5,418). If the price rebounds off this level, it will signal that the traders are viewing the dips as a buying opportunity. That will increase the likelihood of the resumption of the uptrend. The index may climb to 5,600 and, after that, march toward 6,000.
Conversely, if the price turns down from the current level and breaks below the 20-day EMA, it will signal that the bulls are rushing to the exit. That may pull the price down to the 50-day simple moving average (5,279).
U.S. Dollar Index price analysis
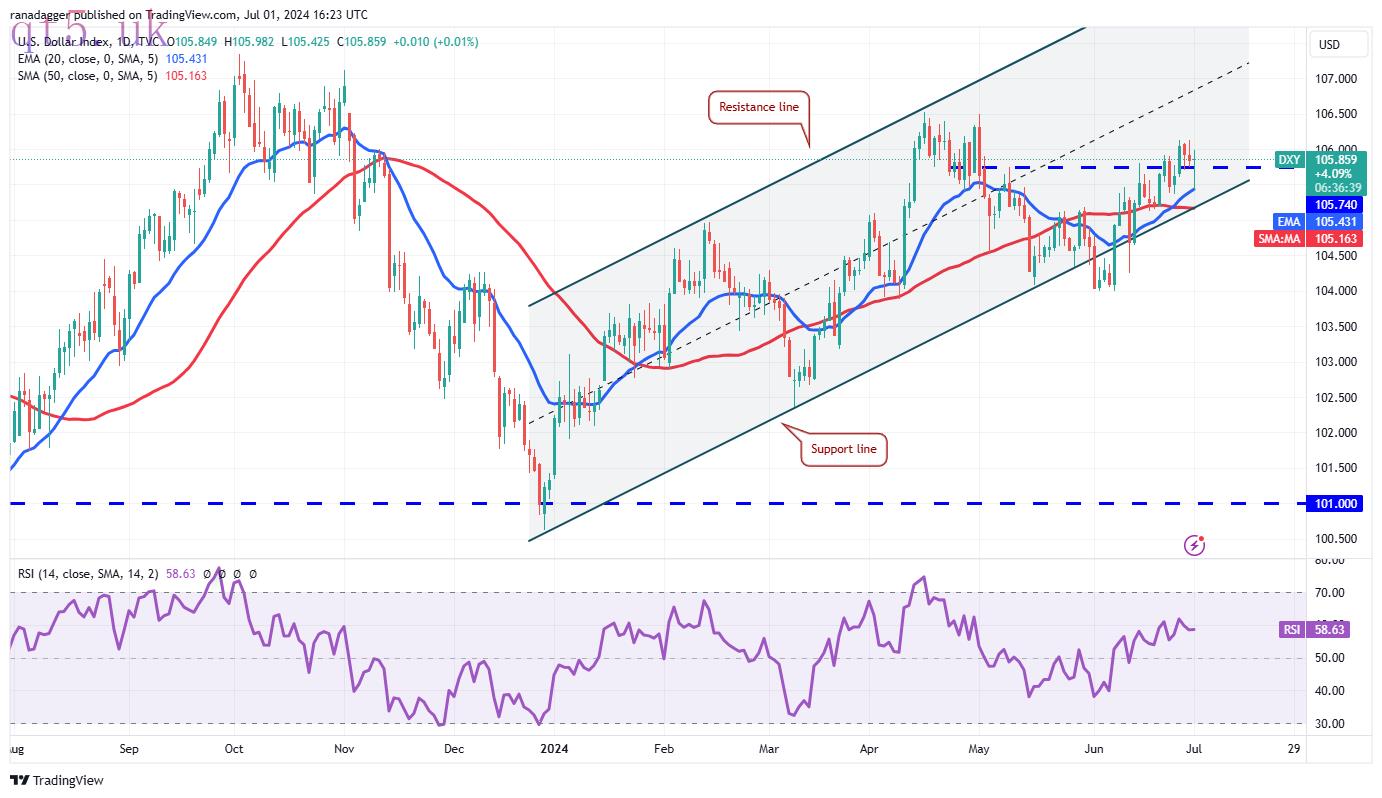
The bulls pushed the U.S. Dollar Index (DXY) above the 105.74 resistance on June 26, but the bears pulled the price back below the breakout level on July 1.
 DXY daily chart. Source: TradingView
The solid bounce off the 20-day EMA (105.43) suggests that the sentiment remains positive and the bulls are buying the dips. There is a minor resistance at 106.13, but if this level is crossed, the index may travel to 106.50.
If bears want to prevent the upside, they will have to quickly yank the price below the channel’s support line. The index could then plummet to 104, where the buyers are expected to step in.
Bitcoin price analysis
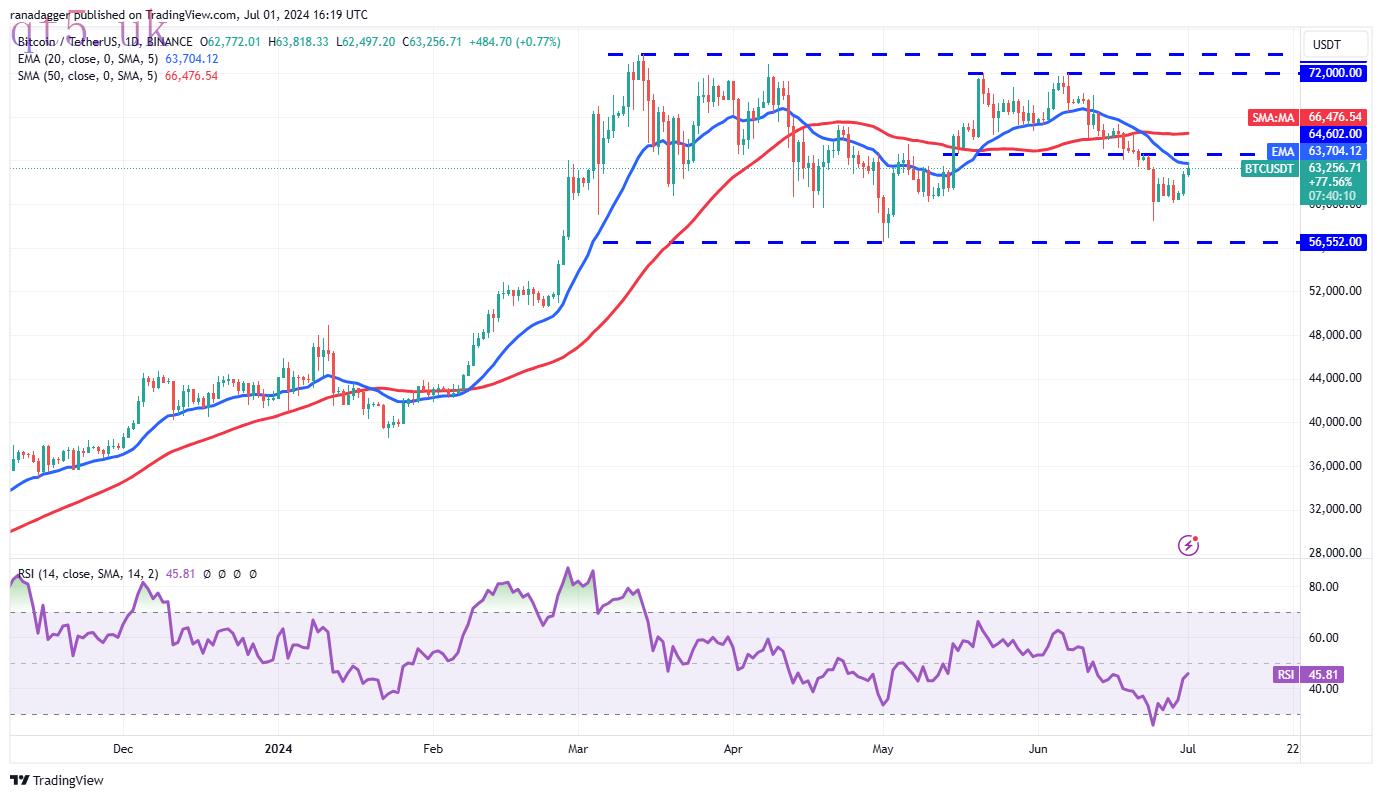
Bitcoin’s tight range trading resolved to the upside with a break above $62,500 on June 30. The bulls are trying to strengthen their position further by pushing the price above the $64,602 resistance.
 BTC/USDT daily chart. Source: TradingView
If they succeed, the BTC/USDT pair could reach the 50-day SMA ($66,476) and later attempt a move to $72,000. The bears are expected to vigorously protect the $72,000 to $73,777 zone.
If the price turns down sharply from $64,602, it will suggest that the bears are trying to flip the level into resistance. The pair may descend to $60,000 and then to $56,552. A sharp rebound off this zone will suggest that the pair may extend its stay inside the range for a few more days.
Ether price analysis
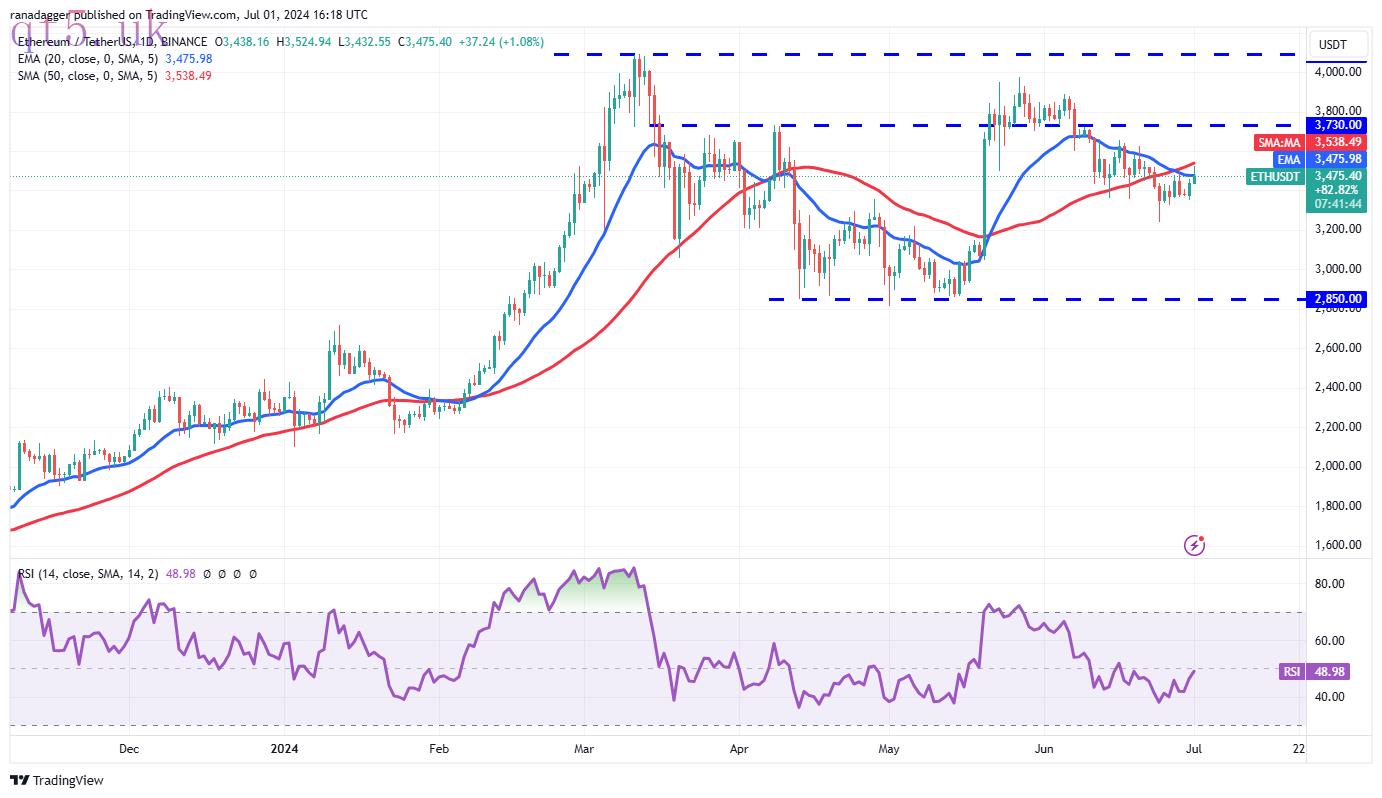
The bulls are trying to start a relief rally in Ether (ETH), which is likely to face strong resistance at the moving averages.
 ETH/USDT daily chart. Source: TradingView
If the price turns down from the 50-day SMA ($3,538), the bears will make one more attempt to tug the ETH/USDT pair to $3,200 and later to the psychological support at $3,000.
Alternatively, if the price rises above the 50-day SMA, it will signal that the correction may be over. The pair may climb to $3,730, which is again expected to behave as a solid resistance. However, if the bulls prevail, the pair is likely to begin a move toward the stiff overhead resistance of $4,094.
BNB price analysis
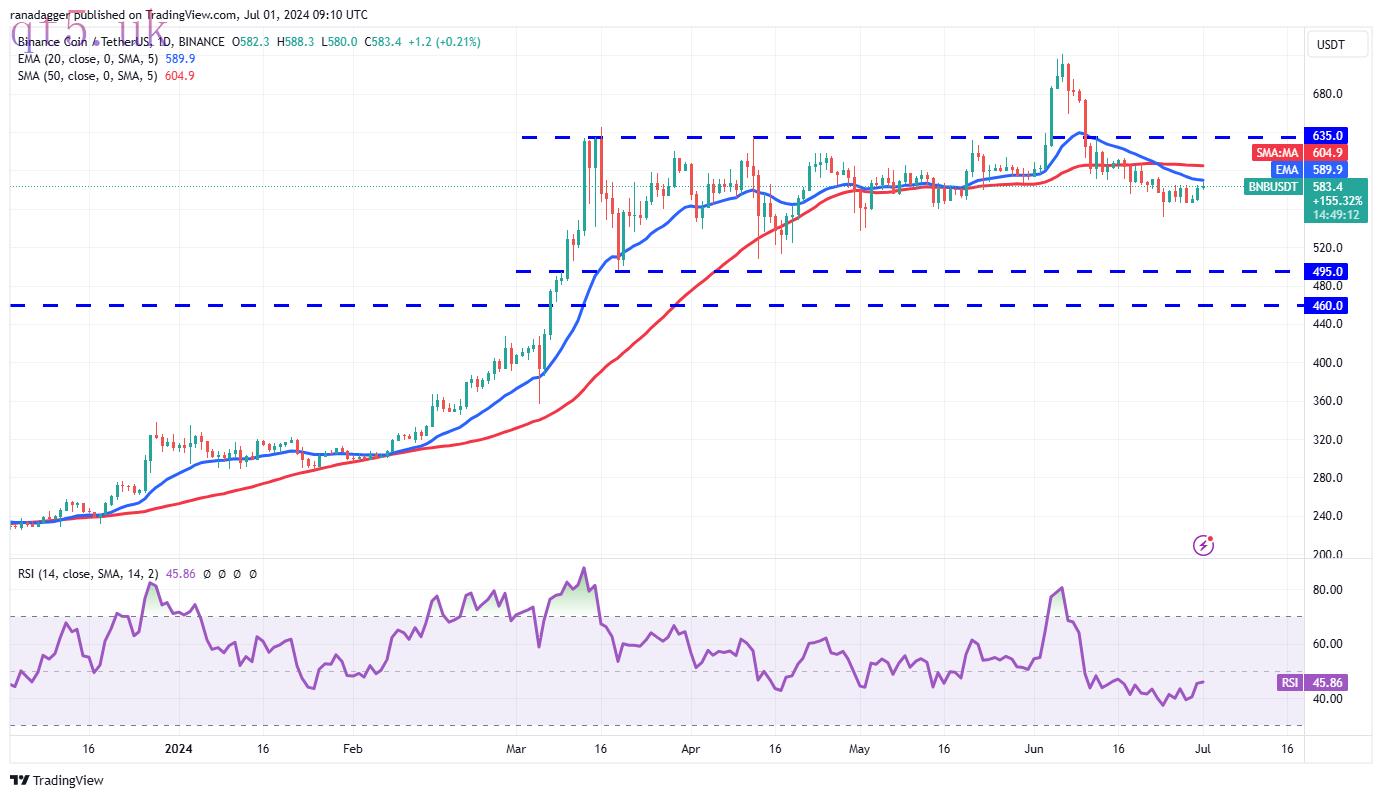
The failure of the bears to pull BNB (BNB) below the $560 support suggests that selling dries up at lower levels.
 BNB/USDT daily chart. Source: TradingView
The bulls will try to push the price above the moving averages and clear the path for a potential rally to the overhead resistance of $635. A break above this resistance will suggest that the bulls are back in the driver’s seat.
Contrarily, if the price turns down from the overhead resistance, the BNB/USDT pair may swing between $635 and $560 for a while. The short-term advantage will tilt in favor of the bears if they yank the price below $560. The pair may then slide to $536 and eventually to $495.
Solana price analysis
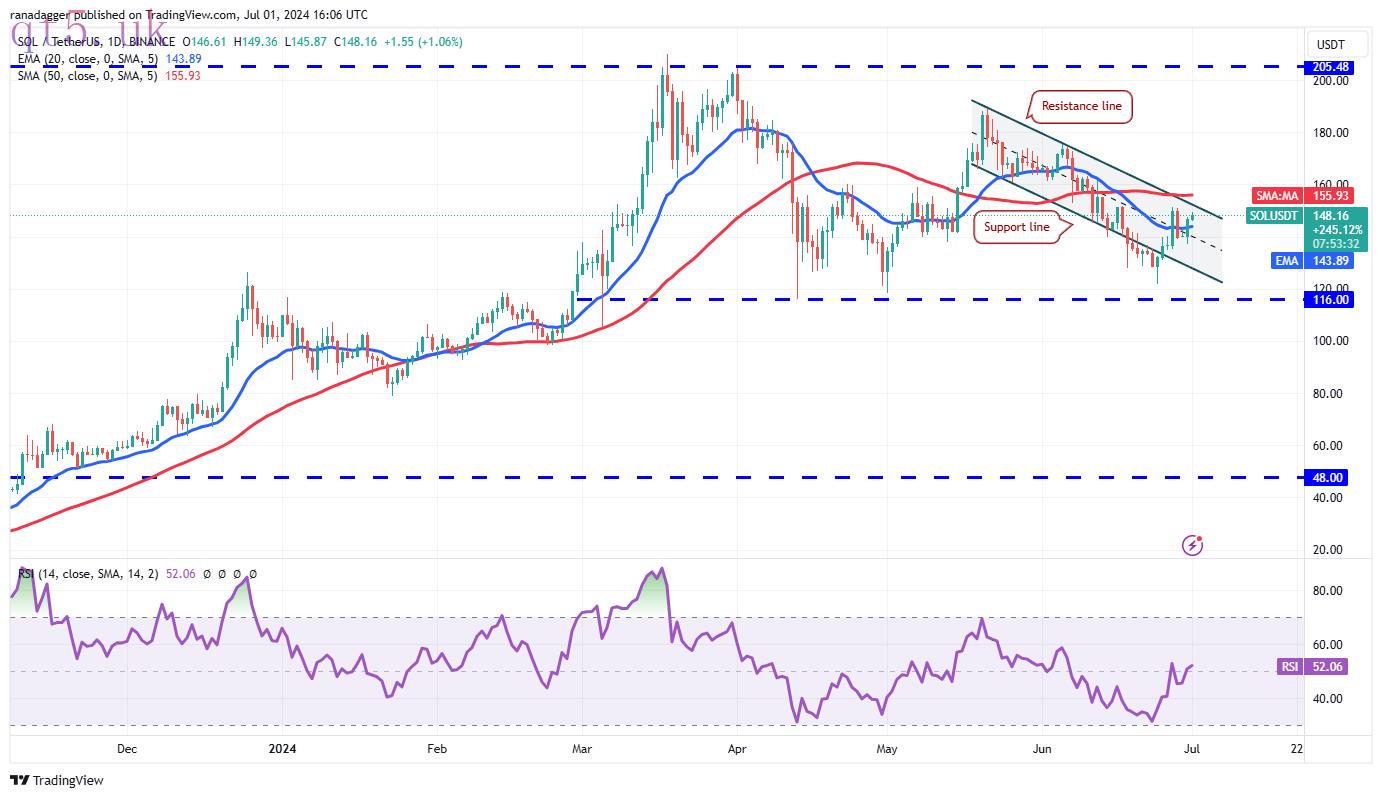
The bears pulled Solana (SOL) below the 20-day EMA ($143) on June 28, but could not sustain the lower levels.
 SOL/USDT daily chart. Source: TradingView
The bulls purchased the dip and are again trying to shove the price above the resistance line. If they manage to do that, it will suggest that the correction may be over. The SOL/USDT pair could rise to $175 and later to $188.
Instead, if the price turns down sharply from the resistance line, it will signal that the bears remain active at higher levels. The sellers will then make one more attempt to sink the pair to the strong support at $116.
XRP price analysis
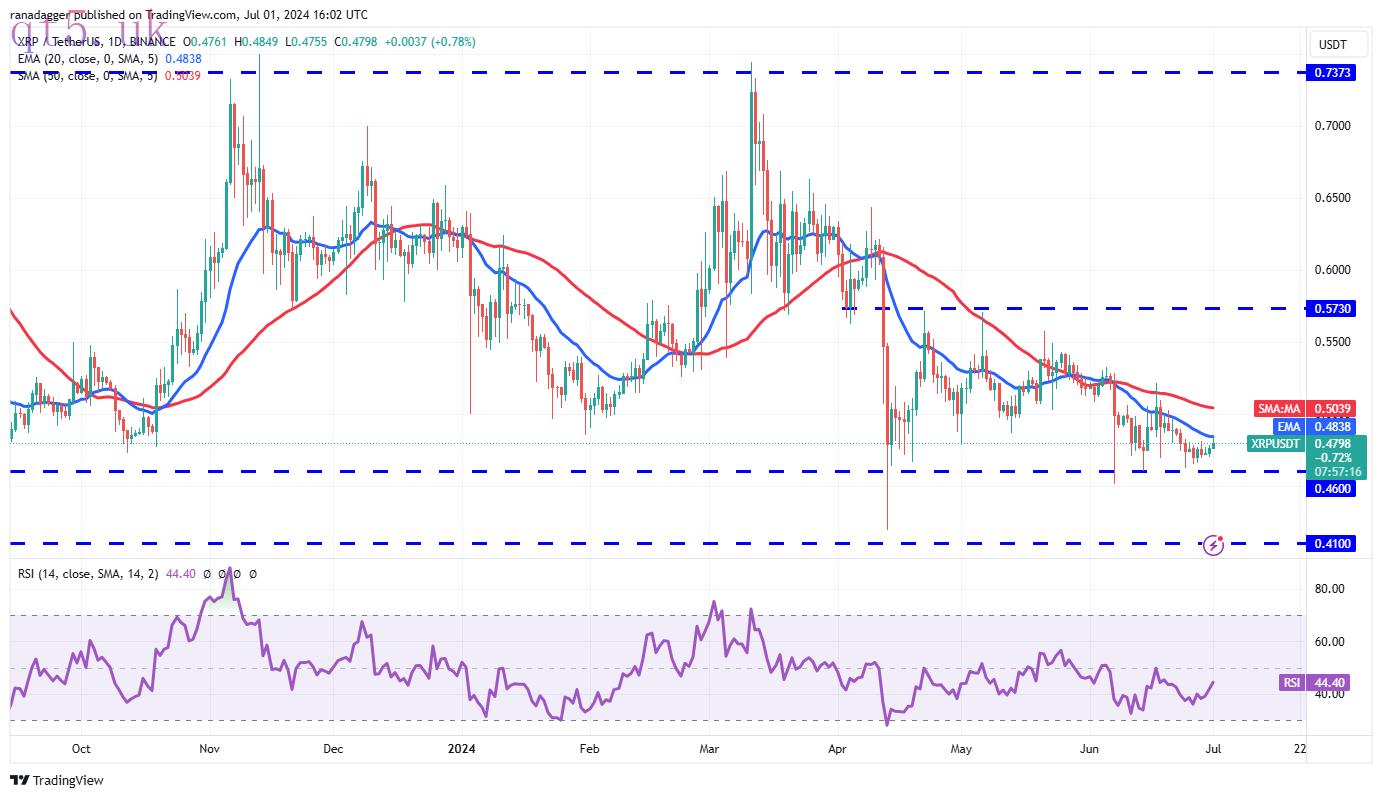
XRP (XRP) has been trading below the 20-day EMA ($0.48) for the past few days, but the bears failed to yank the price below the $0.46 support.
 XRP/USDT daily chart. Source: TradingView
The bulls will try to push the price to the 50-day SMA ($0.50), an important level to watch out for. If buyers overcome this obstacle, the XRP/USDT pair could move to $0.53 and thereafter to $0.57.
The essential level to watch on the downside is $0.46. If this level breaks down, the selling could pick up, and the pair may slump to $0.41. Buyers are expected to aggressively defend the $0.41 to $0.46 zone.
Related: Here’s what happened in crypto today
Toncoin price analysis
Toncoin (TON) bounced off the 20-day EMA ($7.45) on June 29, indicating that the bulls are buying on minor dips.
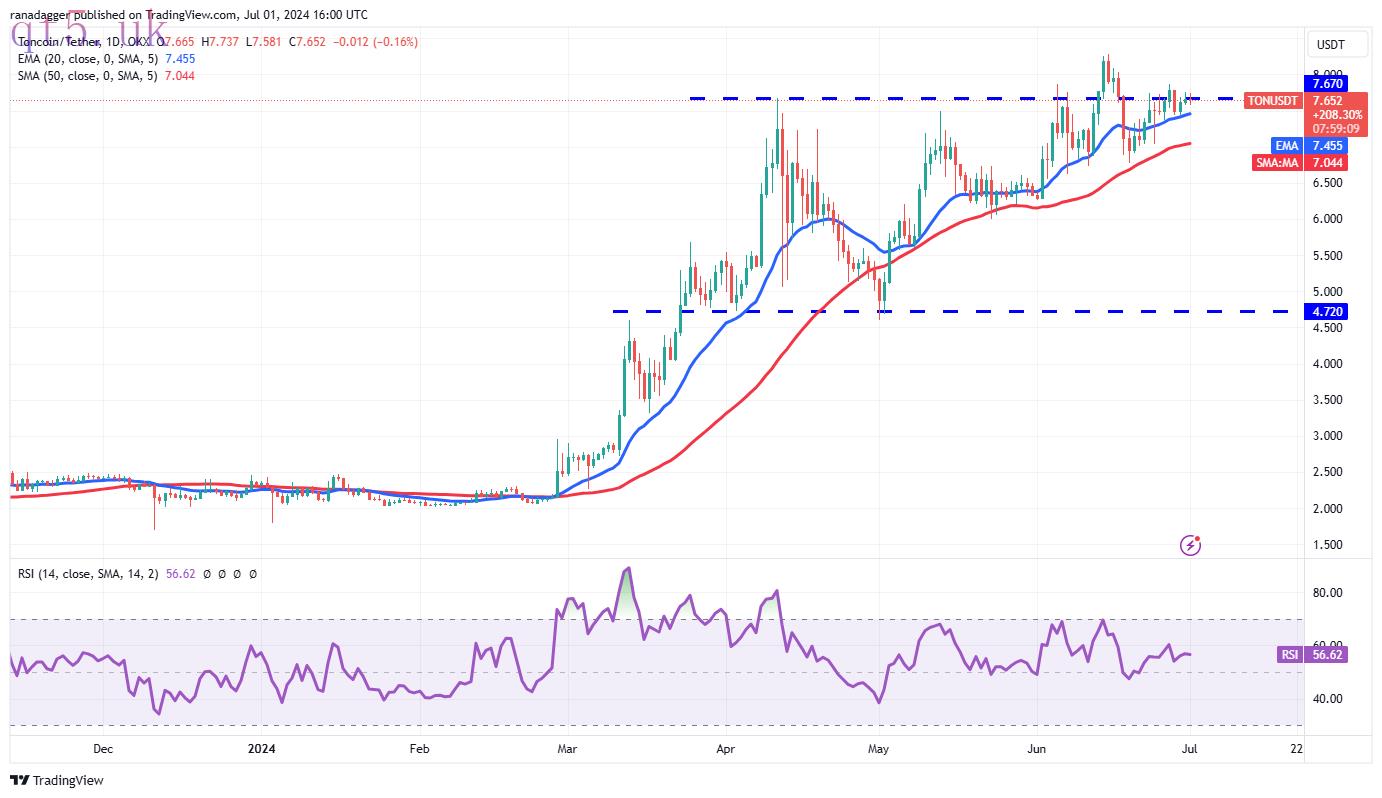 TON/USDT daily chart. Source: TradingView
The gradually upsloping 20-day EMA and the RSI in the positive territory suggest that the bulls have a slight edge. There is a minor resistance at $7.87, but if this level gets taken out, the TON/USDT pair may jump to $8.29.
Contrary to this assumption, if the price turns down and breaks below the 20-day EMA, it will signal that the bulls are booking profits. That may open the doors for a fall to the 50-day SMA ($7.04) and later to $6.60.
Dogecoin price analysis
The bears have failed to sink Dogecoin (DOGE) below the $0.12 support, indicating that the bulls are fiercely defending the level.
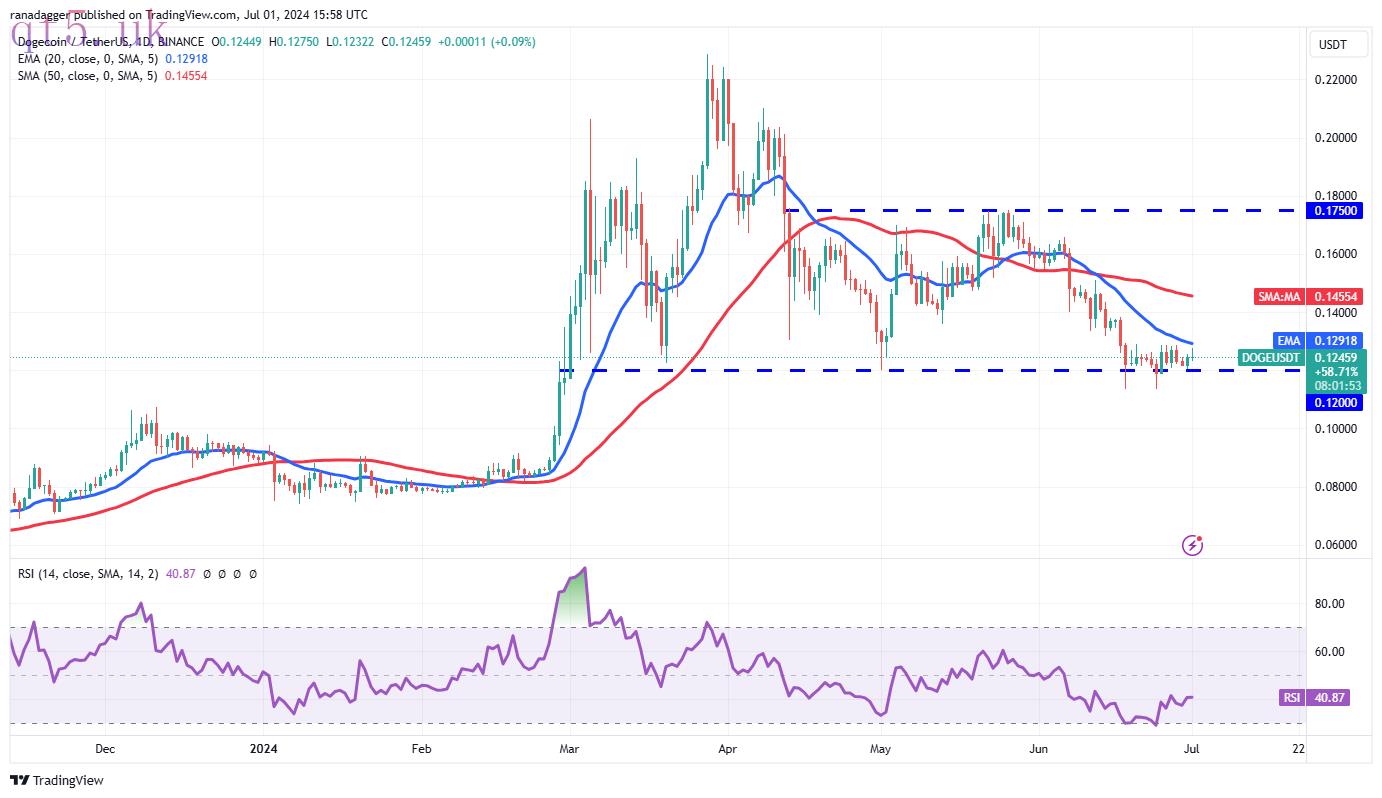 DOGE/USDT daily chart. Source: TradingView
Buyers will try to drive the price above the 20-day EMA ($0.13) and strengthen their position. If they can pull it off, the DOGE/USDT pair could climb to the 50-day SMA ($0.14). That will suggest the pair may remain inside the $0.12 to $0.18 range for some more time.
This optimistic view will be invalidated in the near term if the price continues lower from the current level and breaks below $0.12. The pair could then start a decline to the psychological support at $0.10.
Cardano price analysis
Cardano (ADA) has been trading near the $0.40 resistance for the past few days, indicating that the bulls have maintained the buying pressure.
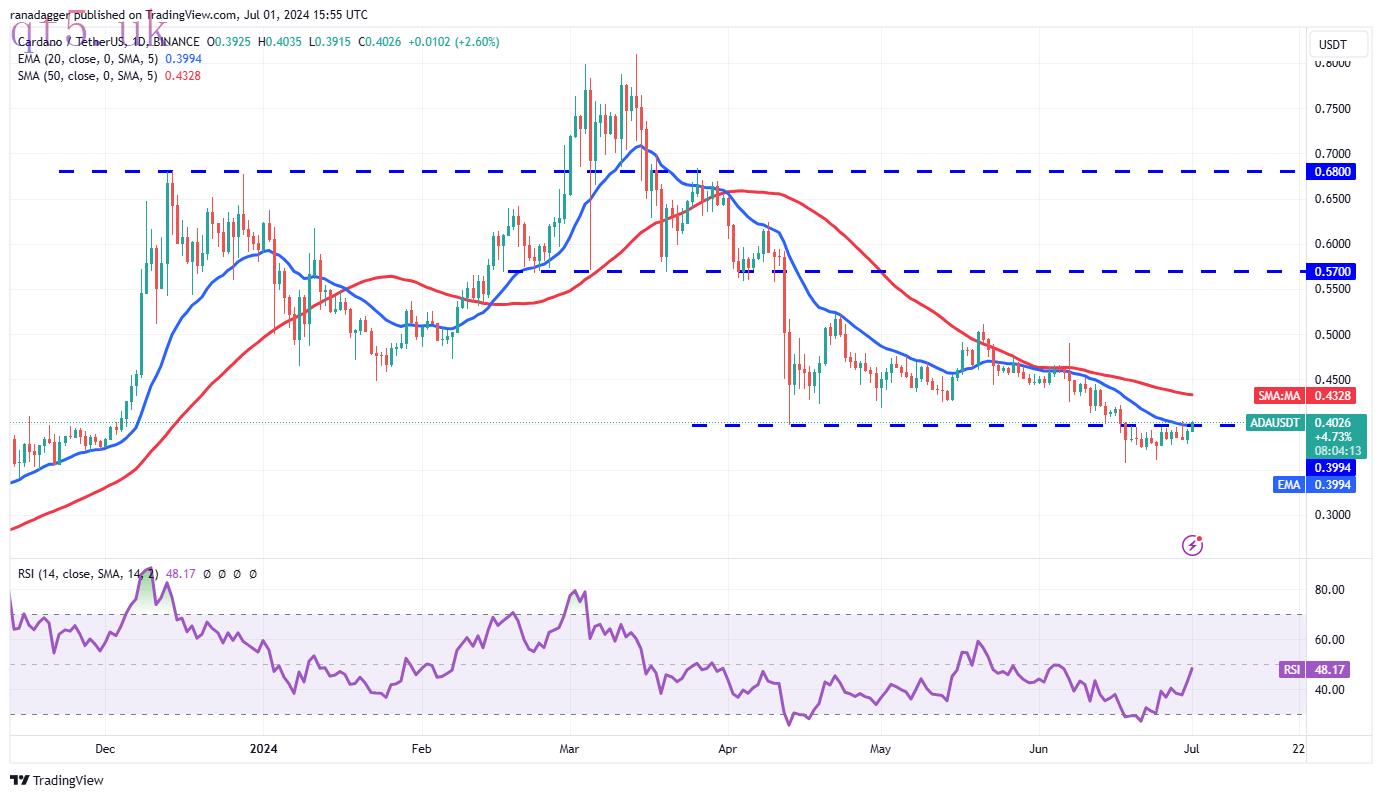 ADA/USDT daily chart. Source: TradingView
The flattening 20-day EMA ($0.40) and the RSI near the midpoint suggest that the bears are losing their grip. If the price sustains above $0.40, the ADA/USDT pair could rally to the 50-day SMA ($0.43) and subsequently to $0.51.
On the contrary, if the price turns down sharply from the current level, it will signal that the bears have flipped the $0.40 level into resistance. That may sink the pair to the critical support at $0.35.
This article does not contain investment advice or recommendations. Every investment and trading move involves risk, and readers should conduct their own research when making a decision.


 download
 download
 website