Bitcoin (BTC) is trying to build upon its gains above the psychological support of $70,000. The sentiment received a boost after the spot Bitcoin exchange-traded funds recorded the second highest inflows of $887 million on June 4, per Farside Investors data.
Analysts are closely watching next week’s United States Consumer Price Index (CPI) data. After the 0.1% drop in the CPI data on May 15, Bitcoin started a 7% rally over the following five days. 10x Research head of research, Markus Thielen, believes that if the year-on-year CPI is 3.3% or lower, it could propel Bitcoin to a new all-time high.
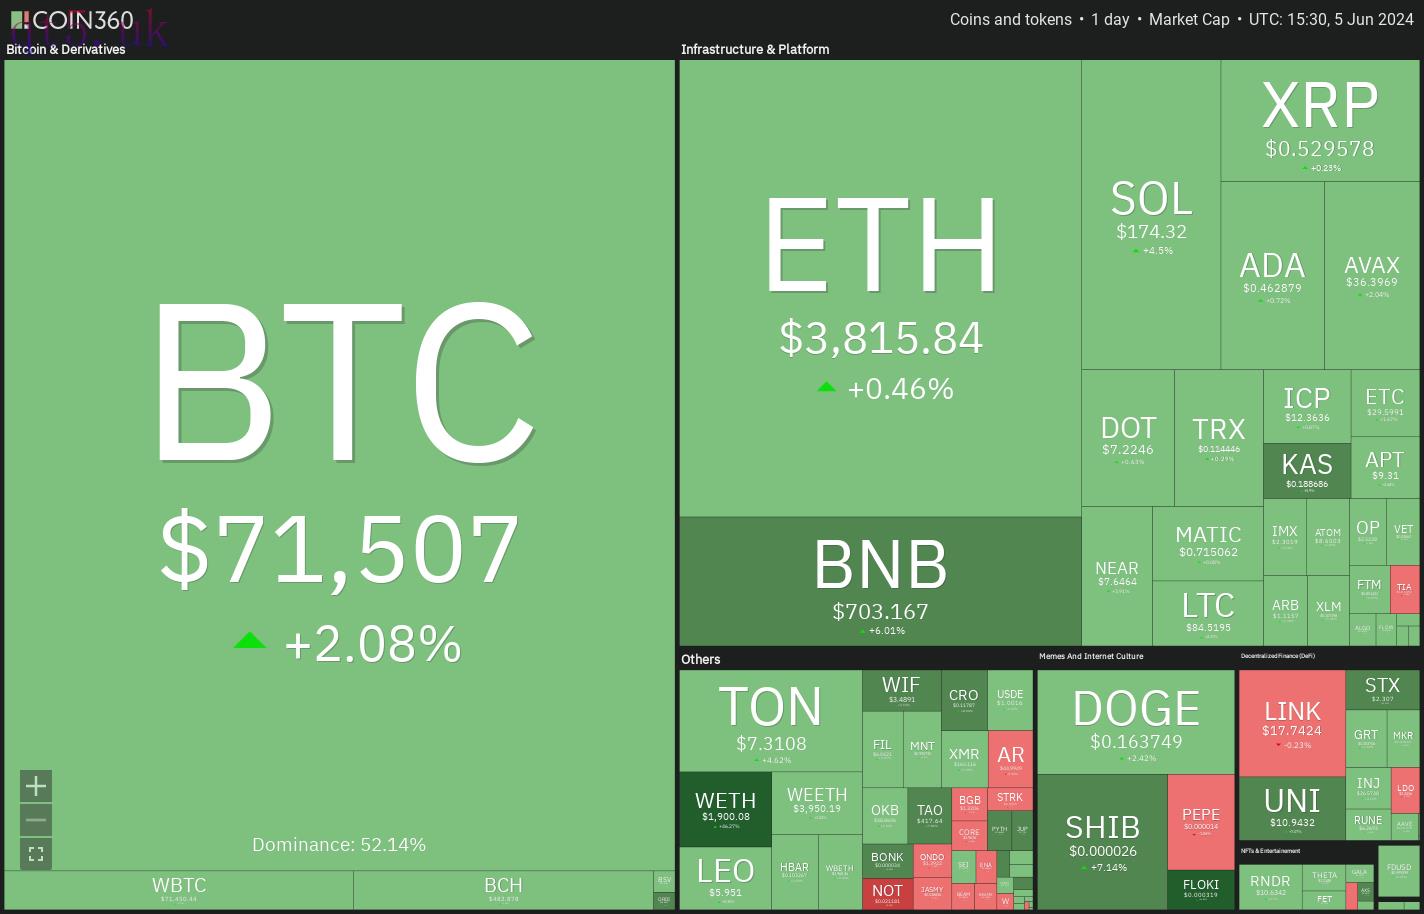 Crypto market data daily view. Source: Coin360
Fidelity Investments head of digital asset strategies Matt Horne said in a June 4 CNBC report that investors should consider a 1-5% allocation to Bitcoin. Such an investment will minimize risk even if Bitcoin were to go to zero, but it will benefit the portfolio if Bitcoin continues its uptrend.
Could buyers drive Bitcoin and select altcoins above their respective overhead resistance levels? Let’s analyze the charts of the top 10 cryptocurrencies to find out.
Bitcoin price analysis
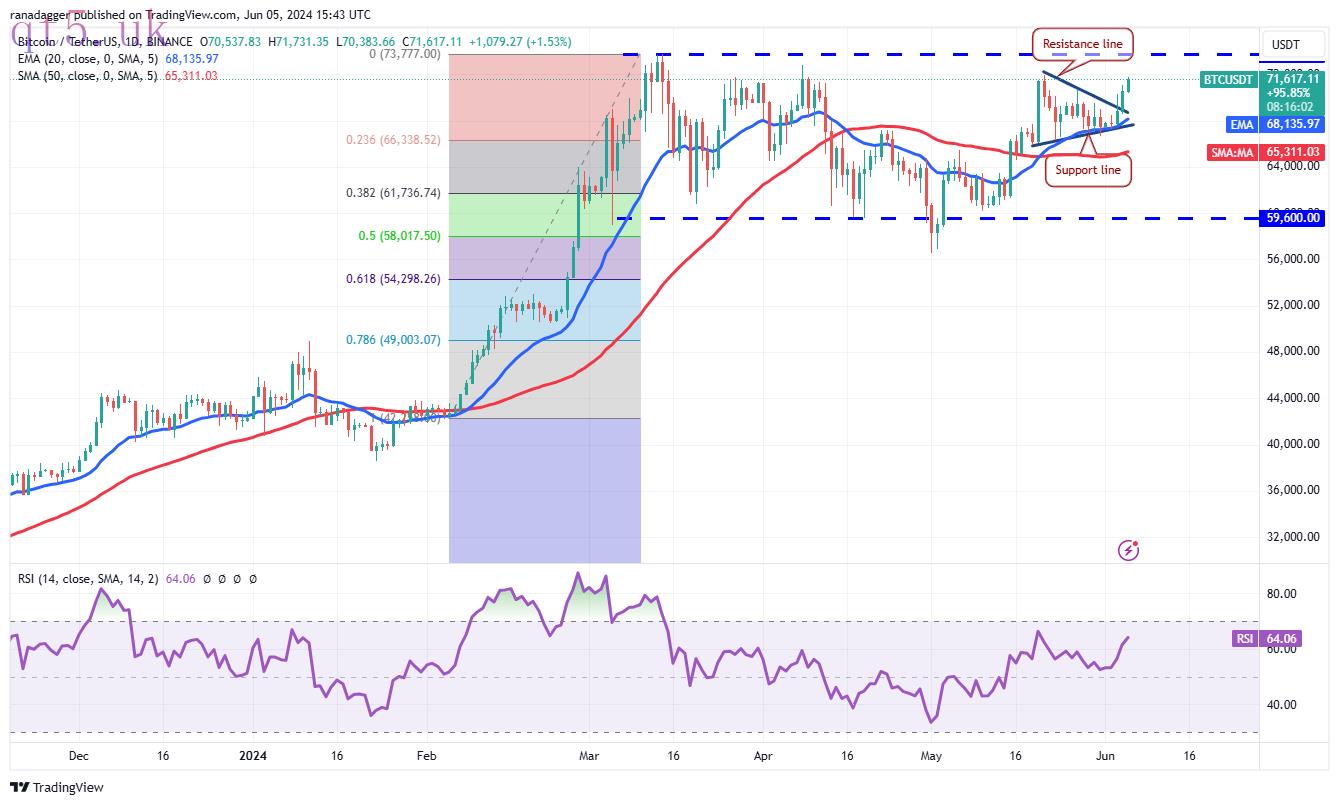
Bitcoin broke and closed above the symmetrical triangle pattern on June 4, indicating that the uncertainty resolved in favor of the buyers.
 BTC/USDT daily chart. Source: TradingView
The 20-day exponential moving average ($68,135) has started to turn up gradually, and the relative strength index (RSI) is in the positive zone, indicating an advantage to the bulls. The BTC/USDT pair is likely to rally to $73,777, which will likely be a formidable resistance.
If the price turns down sharply from $73,777, it will suggest that the range-bound action may extend for a few more days. On the other hand, a break above $73,777 will clear the path for a rally to $80,000 and then to $88,000.
Ether price analysis
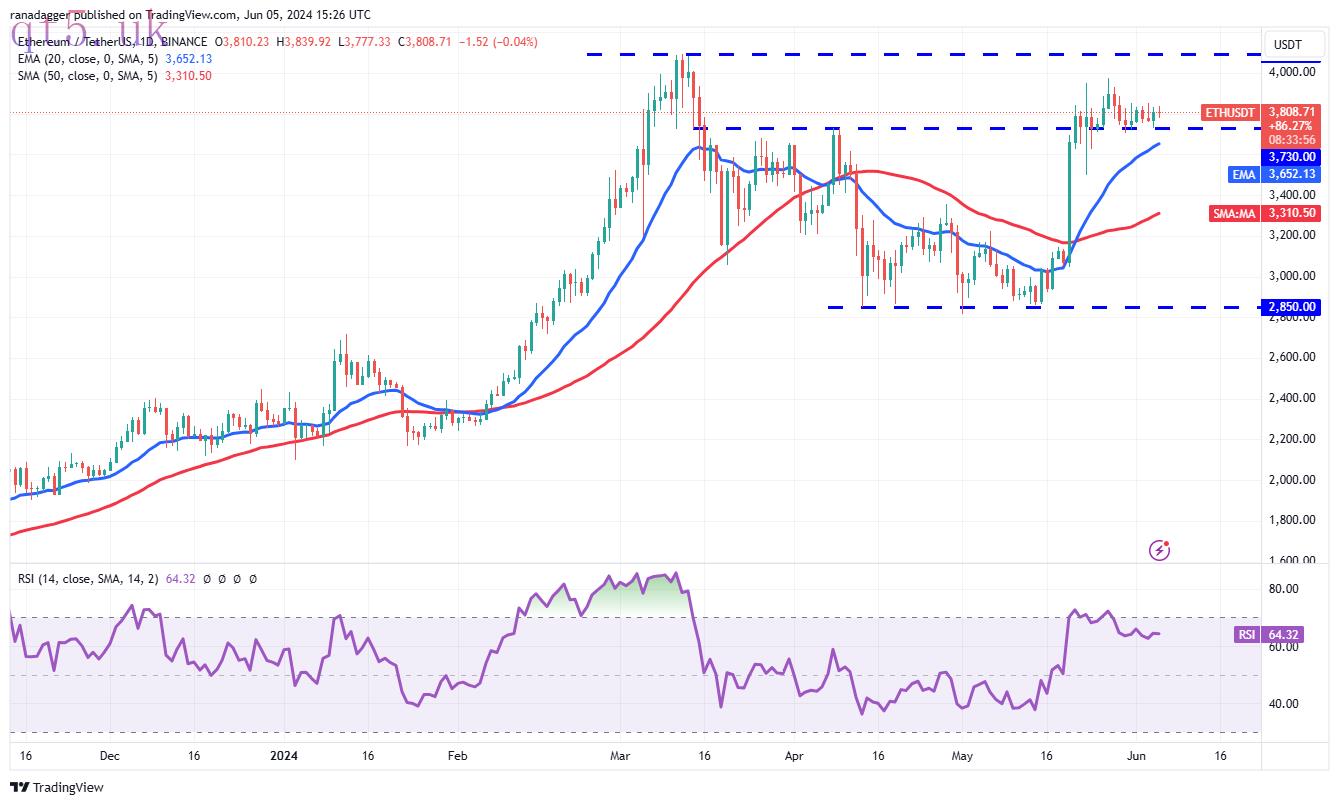
Ether (ETH) has been trading in a tight range near the critical support of $3,730, signaling that the bulls are defending the level but have failed to start a strong rebound off it.
 ETH/USDT daily chart. Source: TradingView
If the price turns down and breaks below the 20-day EMA ($3,652), it will suggest that the bulls have given up. That may start a downward move to the 50-day simple moving average ($3,310) and eventually to $2,850.
Alternatively, if the price jumps from the current level with force, it will signal aggressive buying by the bulls. A break and close above $4,100 will suggest the resumption of the uptrend. The ETH/USDT pair may then surge to $4,868.
BNB price analysis
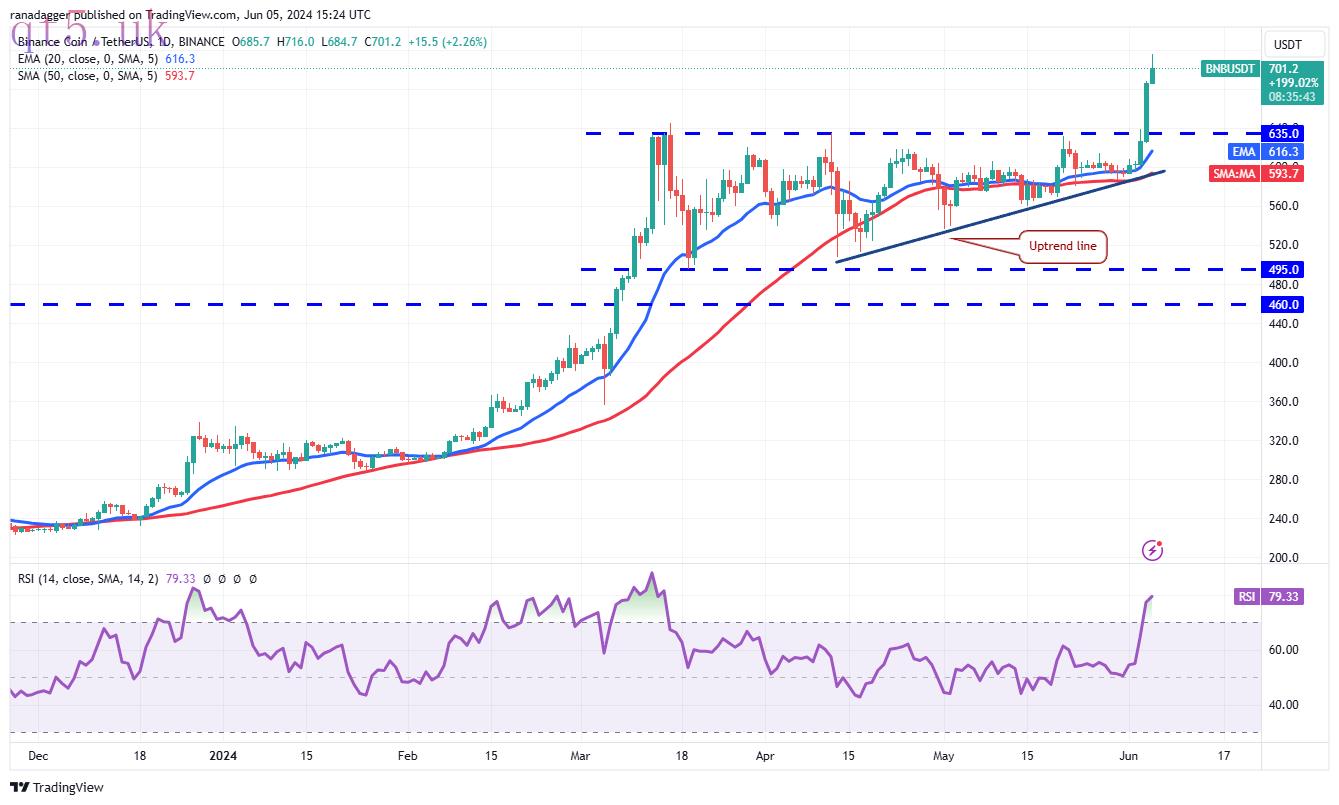
BNB (BNB) pole-vaulted above the $635 resistance on June 4, completing an ascending triangle pattern.
 BNB/USDT daily chart. Source: TradingView
The bulls maintained their buying and pushed the price above the $692 overhead resistance on June 5. If buyers sustain the higher levels, the BNB/USDT pair could extend the up move to the pattern target of $775.
Generally, after rising above a strong overhead resistance level, the price turns down and retests the breakout level. The bears will try to pull the price to $635. If buyers flip the level into support, the uptrend may resume. The bears will be back in the game if they sink the pair below the uptrend line.
Solana price analysis
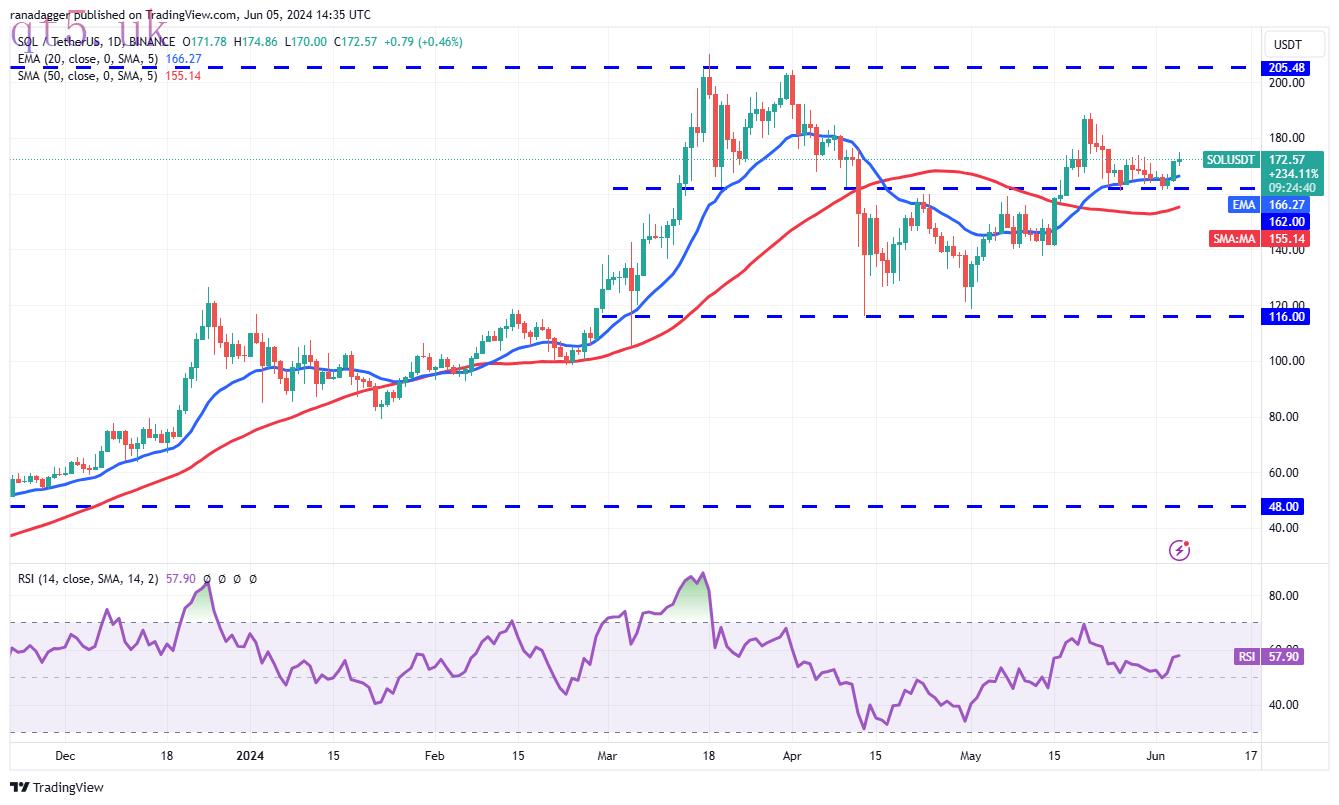
Solana (SOL) rose from the breakout level of $162 on June 3, signaling that the bulls are trying to flip the level into support.
 SOL/USDT daily chart. Source: TradingView
The 20-day EMA ($166) is gradually sloping up, and the RSI is in positive territory, indicating that the bulls are in command. The SOL/USDT pair could reach $189, and then the overhead resistance at $205.
This bullish view will be invalidated in the near term if the price turns down and plunges below the 50-day SMA ($155). The pair could then drop to $140, where the bulls will try to arrest the decline.
XRP price analysis
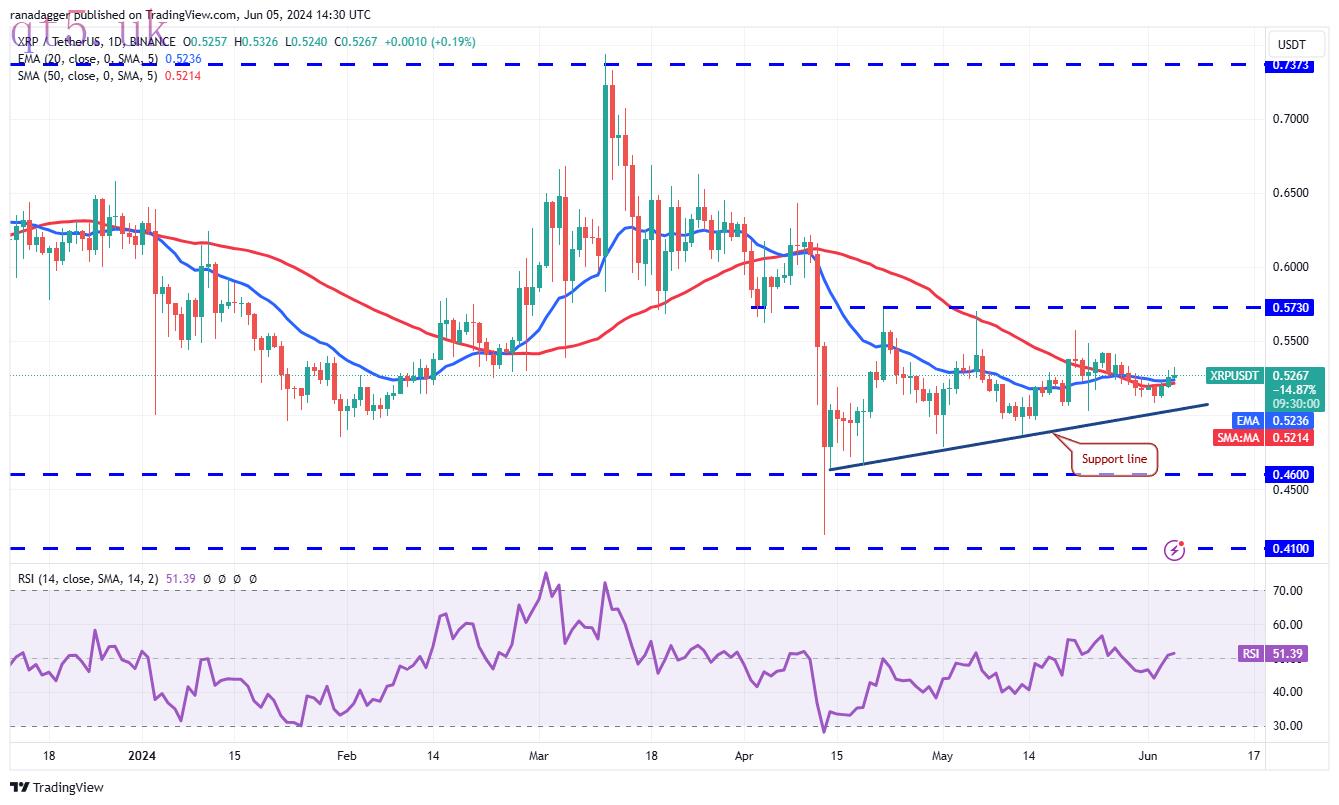
XRP (XRP) has been clinging to the moving averages for several days, indicating uncertainty about the next directional move.
 XRP/USDT daily chart. Source: TradingView
The bulls will try to push the price to the overhead resistance of $0.57. A break and close above this barrier will complete the ascending triangle pattern, which could start an up move to the pattern target of $0.68.
Contrary to this assumption, if the price turns down and breaks below the support line, it will invalidate the bullish setup. That could sink the XRP/USDT pair to the crucial support at $0.46. A bounce off this level may keep the pair inside the $0.46 to $0.57 range for some more time.
Dogecoin price analysis
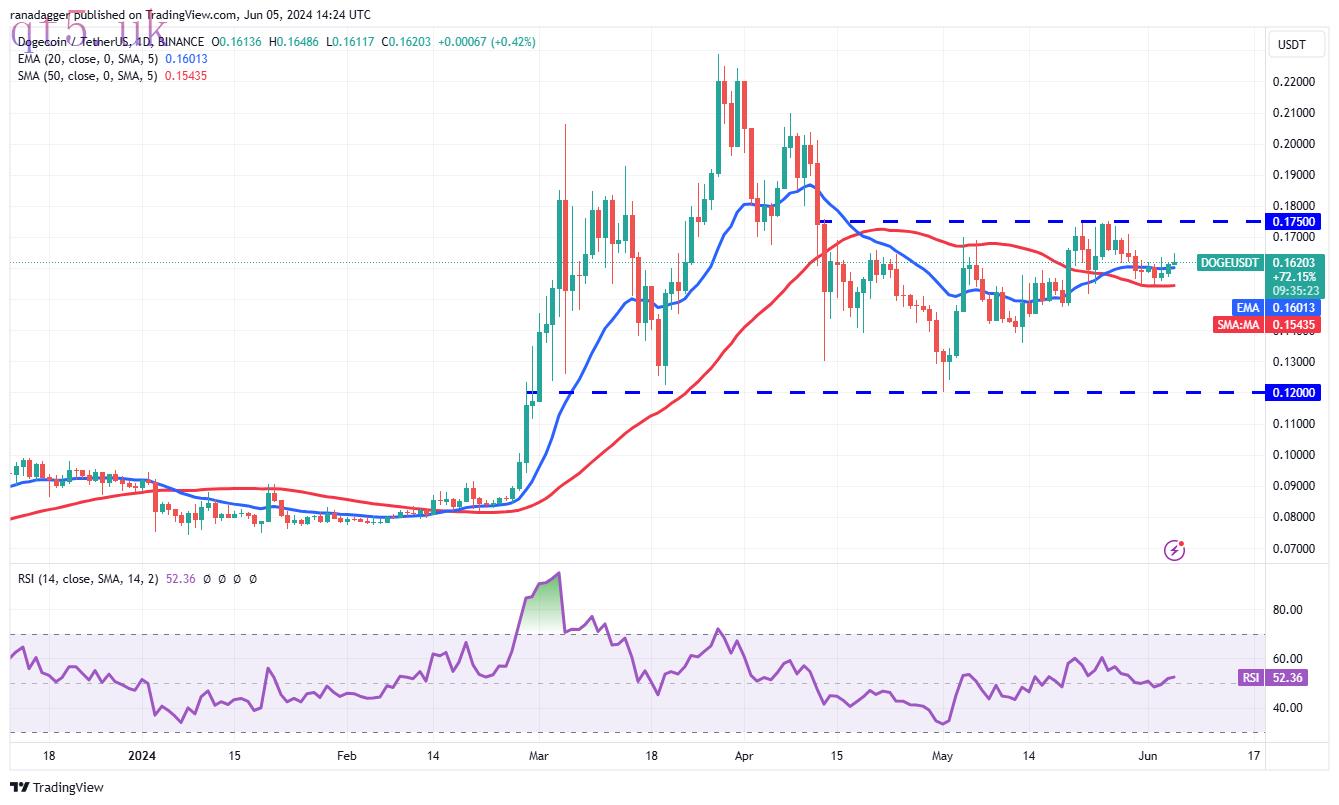
Dogecoin (DOGE) bounced off the 50-day SMA ($0.15) on June 3, indicating robust demand at lower levels.
 DOGE/USDT daily chart. Source: TradingView
The DOGE/USDT pair could rise to the overhead resistance of $0.18, which is an important level to watch out for. If buyers pierce this resistance, the pair could rally to $0.21 and after that to $0.23.
Contrarily, if the price turns down from the current level or the overhead resistance, it will suggest that bears are active at higher levels. The short-term trend will turn negative on a break below the 50-day SMA. The pair may then slump to $0.14.
Toncoin price analysis
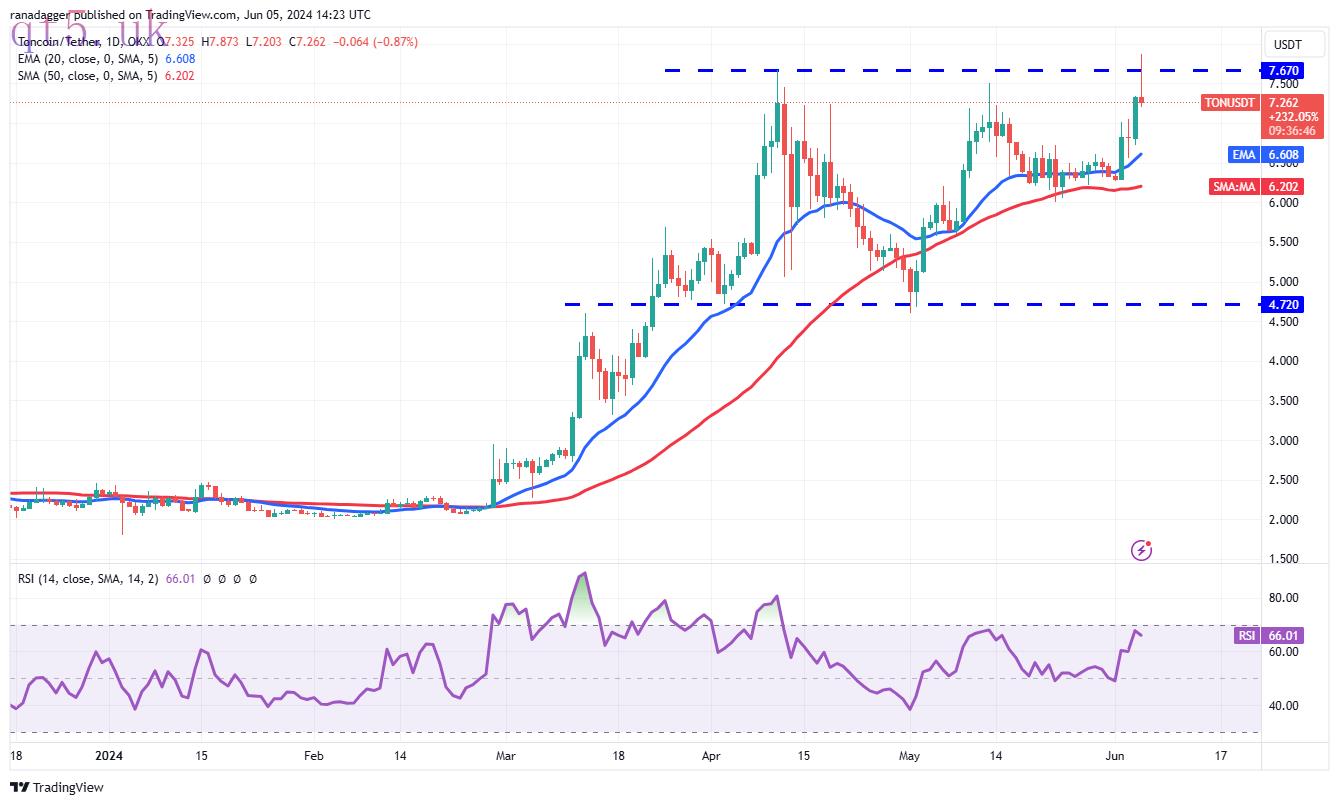
Toncoin (TON) skyrocketed above the $7.67 overhead resistance on June 5, but the long wick on the candlestick shows that the bears are aggressively defending the level.
 TON/USDT daily chart. Source: TradingView
If the price turns down from the current level, it is likely to find support at the 20-day EMA ($6.60). A strong rebound off this support will suggest that the sentiment remains positive and traders are buying on dips. That will improve the prospects of a rally above $7.67. The TON/USDT pair may then climb to $10.
On the contrary, if the price turns down sharply and breaks below the 20-day EMA, it will signal that the pair may swing between $6 and $7.67 for a while.
Related: Why is the BNB price up today?
Shiba Inu price analysis
The bears tried to sink Shiba Inu (SHIB) below the support line on June 4, but the long tail on the candlestick shows solid buying at lower levels.
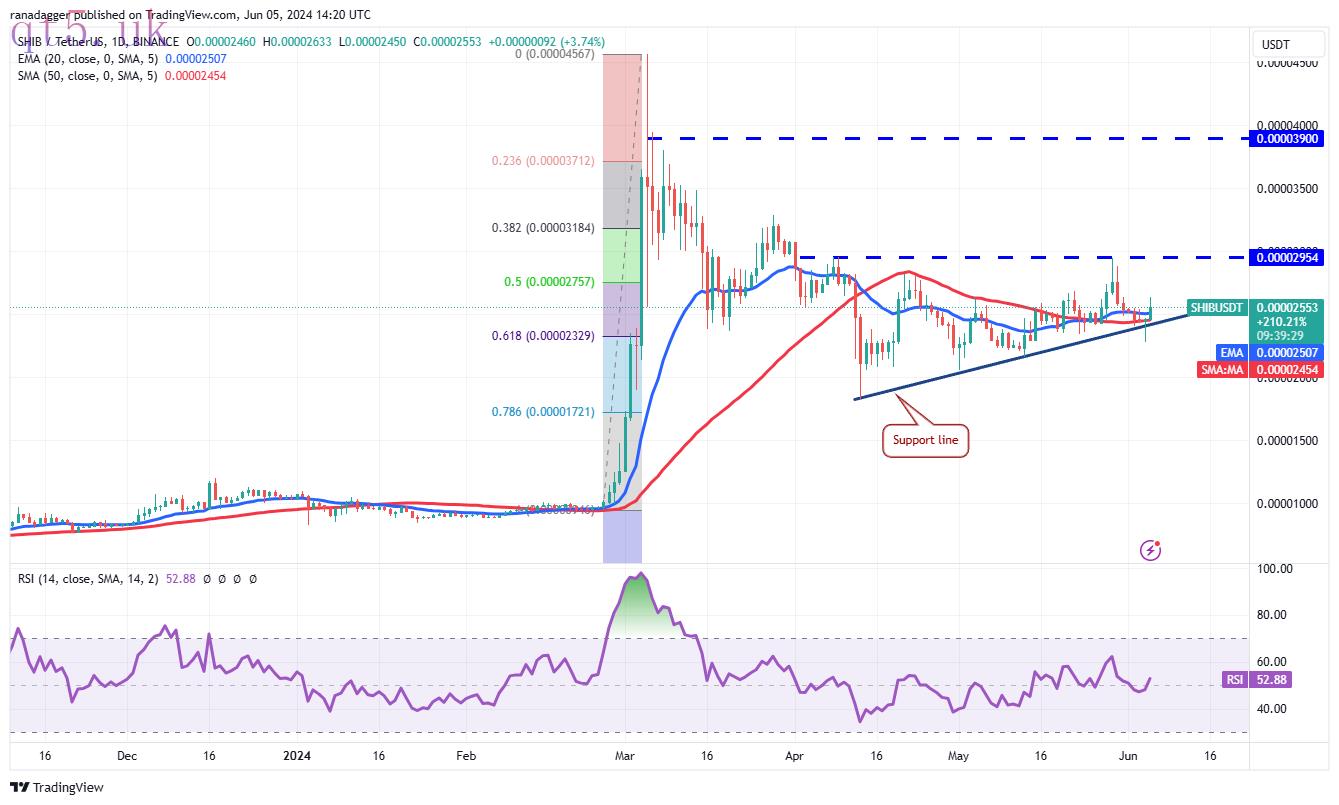 SHIB/USDT daily chart. Source: TradingView
The bulls will try to push the price above the overhead resistance of $0.000030. If they manage to do that, the SHIB/USDT pair will complete a bullish ascending triangle pattern. That could start an upmove toward the overhead resistance level of $0.000039. There is a minor resistance at $0.000033, but it will likely be crossed.
The support line remains the key level to watch out for on the downside because a close below it could sink the pair to $0.000018.
Cardano price analysis
Cardano (ADA) bounced off the support line of the symmetrical triangle pattern on June 3, signaling that the bulls continue to defend level.
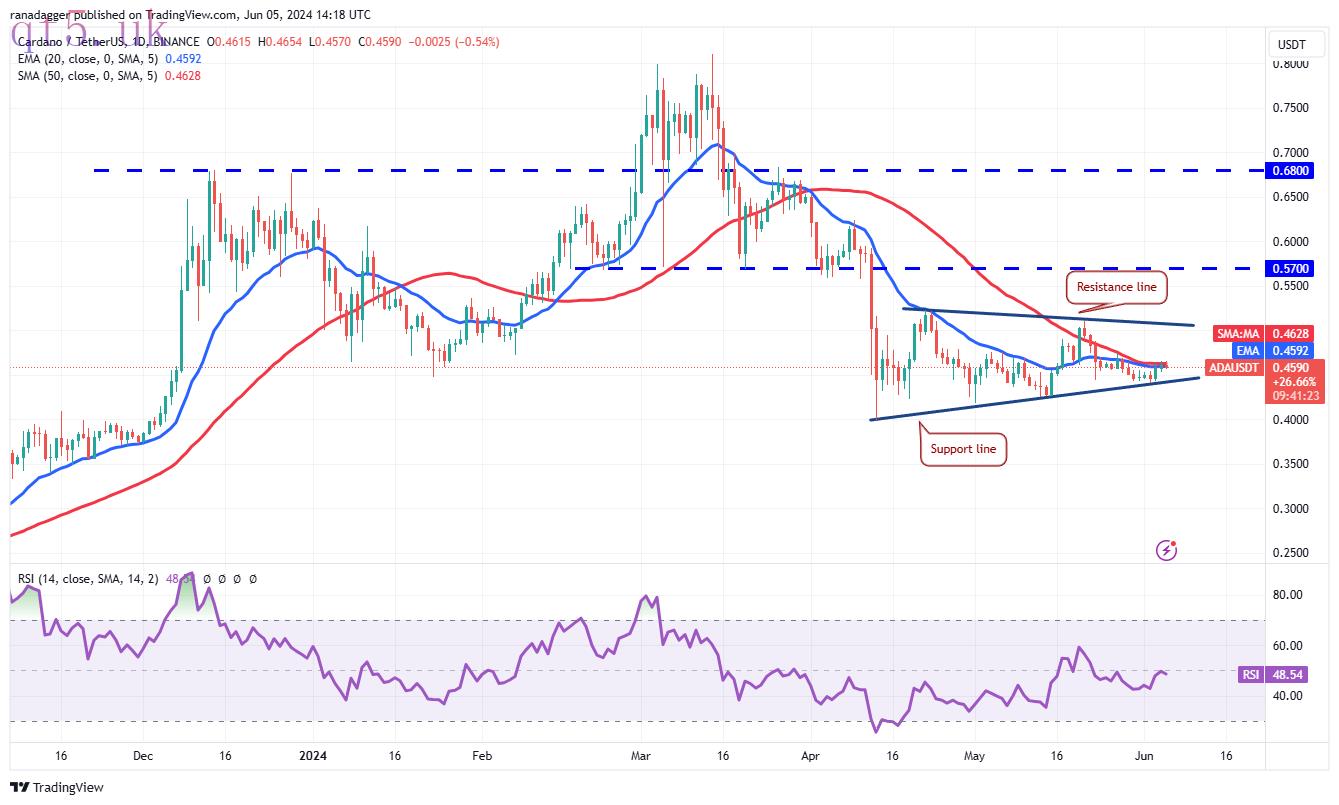 ADA/USDT daily chart. Source: TradingView
If the price rises and maintains above the moving averages, the ADA/USDT pair could gradually attempt a move to the resistance line. The bulls may find it difficult to push the price above the triangle, but if they do, the pair could pick up momentum and surge toward the pattern target of $0.62.
If bears want to prevent the upside, they will have to drag the price below the triangle. If they succeed, the pair may tumble to $0.35.
Avalanche price analysis
Avalanche (AVAX) has been trading below the moving averages for the past few days, but the bears failed to extend the decline. This suggests that selling dries up at lower levels.
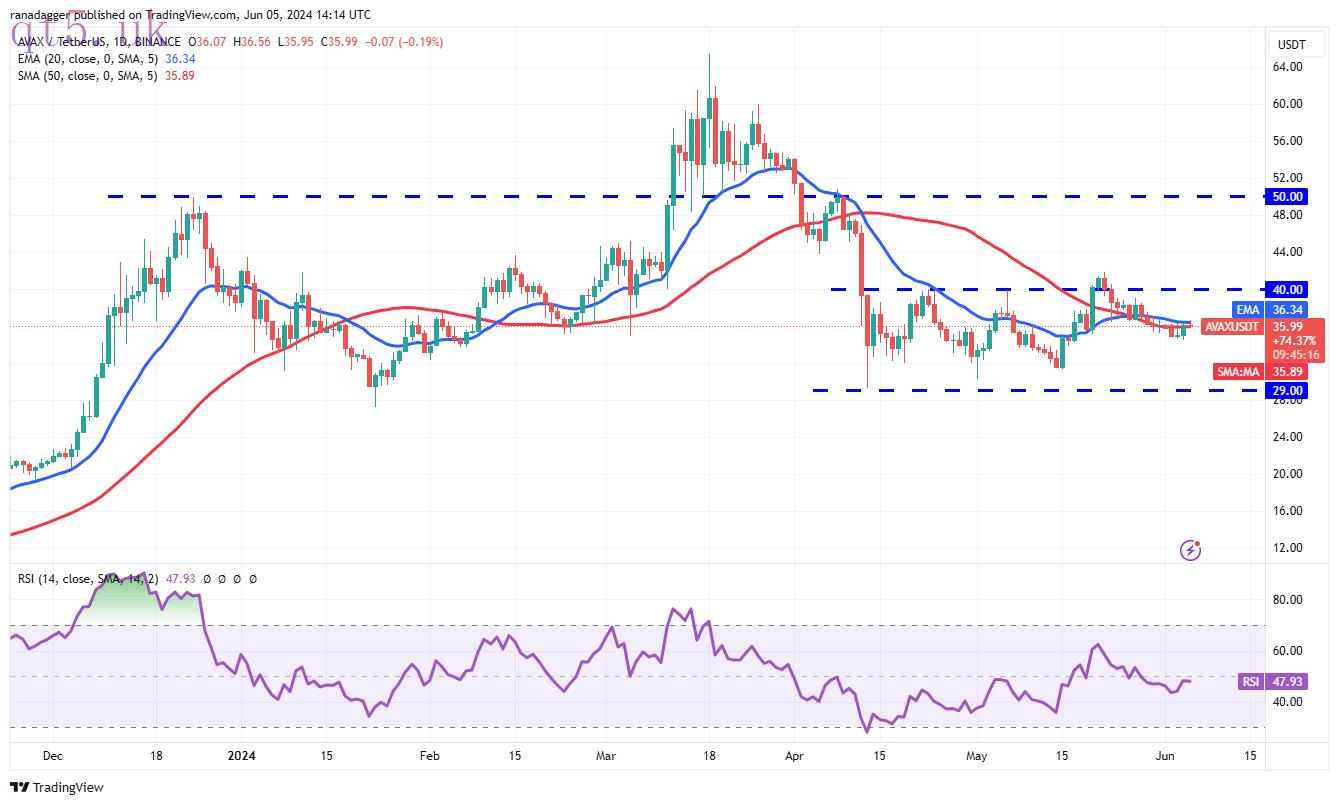 AVAX/USDT daily chart. Source: TradingView
The flattish moving averages and the RSI near the midpoint suggest a balance between supply and demand. If bulls drive the price above the moving averages, the AVAX/USDT pair could rise to the overhead resistance at $42.
This optimistic view will be negated if the price turns down sharply and plummets below the $34 support. The pair could then reach the strong support of $29. A rebound off this level will suggest that the pair may remain range-bound for longer.
This article does not contain investment advice or recommendations. Every investment and trading move involves risk, and readers should conduct their own research when making a decision.


 download
 download
 website